What a wild year it has been. This time last year, the Federal Reserve had just increased the fed funds rate by 50 basis points to a 4.25%-4.50% target range at their December 2022 meeting. At that time, the Dot Plot graph showed a near-uniform view among members that the appropriately restrictive level for rates was above 5.00%. The Federal Open Market Committee sent a clear signal they were more concerned with avoiding a policy error of under-tightening than over-tightening, even if that meant it could push the economy into a recession. Economists at the time projected a 65% probability it would do just that in 2023. However, the economy has proven even more resilient than investors thought it would be this year. This article recaps the past year and what it all might point toward in 2024.
Entering 2023, swaps markets were pricing in just two, 25-basis-point hikes throughout the year. As inflation showed signs of easing, markets made a case for the Fed to slow its pace of rate hikes to prevent a harsher economic downturn. However, resilient consumer demand, especially for services, combined with a tight labor market remained a significant threat to prices. At the FOMC’s first meeting of the year in February, the committee voted unanimously to raise the fed funds rate to a 4.50%-4.75% target range, slowing its hiking pace following a 50-basis-point hike in December and a series of 75-basis-point hikes before that. Over the following weeks, bond yields began to gradually rise as economic reports continued to show resilient consumer spending and exceptional strength in the labor market. This added to the Fed’s tough task of getting inflation to its 2% goal, and Fed officials signaled the central bank would need to keep raising rates to cool inflation.
Through the first quarter, investors really started to see the effects of the Fed’s relentless policy tightening. Jobless claims rose above 200,000 for the first time since early January, and continuing claims jumped by the most since November 2021, putting them back above the pre-pandemic average. Then, troubles at Silvergate Capital Corporation, Signature Bank and Silicon Valley Bank added fuel to the fire and emphasized worsening market sentiment as worries about banks’ liquidity compounded concerns around the Fed tightening more than expected. Over the next several weeks, treasury yields fell across the curve as the Fed weighed the pros and cons of a “wait and see” approach against a continuation of hikes. It chose the latter, unanimously voting to raise the fed funds rate by 25 basis points and keeping the year-end projection intact. Fed Chair Jerome Powell started the press conference that day by noting the banking system is sound and he was prepared to keep tightening until inflation showed signs of cooling.
At the start of the second quarter, the labor market was gradually softening, but remained too strong to put the Fed at ease. The Fed again voted unanimously to increase rates by 25 basis points in early May, while signaling a potential pause in hikes.
Headline nonfarm payrolls increased by 253,000 in April, above the median estimate of 185,000, after a downwardly revised 165,000 increase in March. The two-month net revision was -149,000. Average hourly earnings also came in hot, with a 0.5% increase against the median forecast for 0.3%, the biggest increase in wages since November 2022‡. This brought the last twelve month gain in wages to 4.4%, well above the 3% pace economists view as consistent with a 2% inflation rate. Clearly, this supported the Fed’s decision to hike.
However, the household survey painted a picture of a weaker labor market. Employment rose 139,000 in April (vs 577,000 in the prior month). The labor force fell 43,000 (versus an increase of 480,000 in March) and the labor force participation rate stayed at 62.6%. The dip in labor supply pushed the unemployment rate down to 3.4%, matching the cyclical low reached in January. All in all, the downward revisions to the previous months’ nonfarm payrolls prints, along with the softer print in the household survey, suggested the labor market was softening and perhaps not as strong as the headline number seemed.
In May, payrolls beat estimates for a 14th straight month, but the unemployment rate jumped to 3.7%, the largest monthly jump since the onset of the pandemic. The continuation of mixed economic reports prompted the Fed to hold the target rate steady in June in a 5.00%-5.25% target range.
Employment costs, which are closely watched by the Fed, rose in the second quarter at the slowest pace in two years. “Disinflation” suddenly became the buzzword across trading desks at the start of the third quarter, as consumer price and producer price data showed inflation finally looked to be heading in the right direction. While the annual inflation rate remained above the Fed’s 2.00% target, the sharp slowdown in price and wage growth over the year added to hopes the central bank could tame inflation without causing an economic downturn. The Fed kept its resolve and did not change the inflation target. At the end of July, the Fed raised rates once again by 25 basis points to a 5.25%-5.50% target range, marking the highest level since 2001 and the 11th increase since March of 2022 when rates were near zero.
The FOMC ended the third quarter holding steady, keeping the overnight rate unchanged in September and November. Craig Torres with Bloomberg News‡ pointed out the following excerpt of the Fed’s recent FOMC minutes, “All participants agreed that the committee was in a position to proceed carefully and that policy decisions at every meeting would continue to be based on the totality of incoming information.”
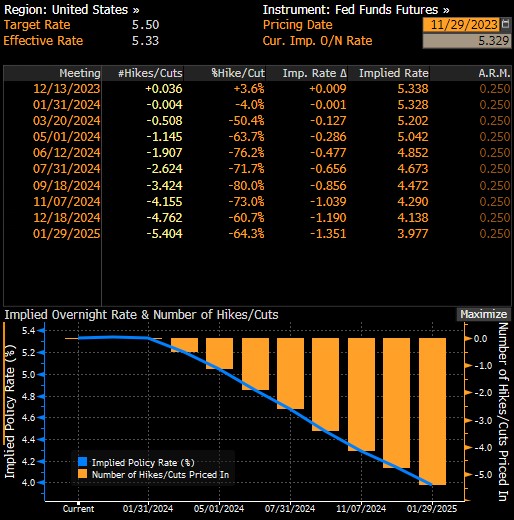
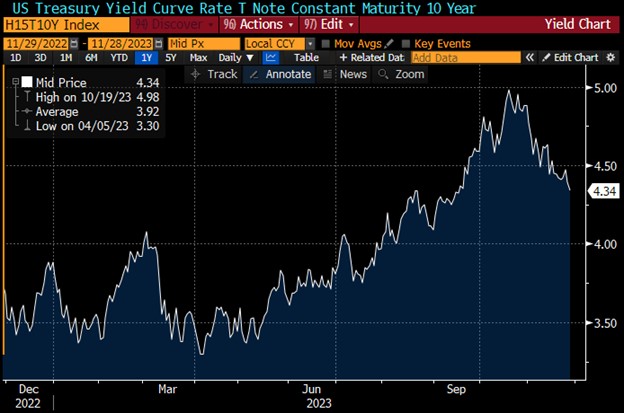
The economy had proven to be somewhat mixed in the third quarter. Consumption reports and hiring data were strong but there were tighter lending standards and rising delinquency rates. The FOMC minutes also touched on reports that higher rates were beginning to negatively affect businesses. Currently, the “wait and see” approach by the Fed is expected to continue through the end of the year. As of the end of November 2023, the probability of a rate hike during the final FOMC meeting of 2023 was only 3.6% and the Fed Funds futures market was “telegraphing” the chances of rate cuts greater than hikes in 2024. Investors in the treasury market seem to be agreeing. The 10-year treasury yield has been on a steady decline from highs near 5.00% in mid-October compared to yields around 4.30% during the last week of November. The same can be said about the two-year treasury yield that swung from 5.20% to approximately 4.65% during the same period.
On a contrary note, a Bloomberg News article‡ that came out a week after the November 1 FOMC meeting warned of the risk that the Fed may continue to raise rates. The article said Henry Allen, a Deutsche Bank macro strategist, wrote a report claiming, “This is at least the seventh time this cycle that expectations have risen about a dovish central bank pivot.” Furthermore, Allen expressed that, “expectations of a pivot can actually make one less likely, since it eases financial conditions that central banks then feel the need to tighten again in order to bring down inflation.” The article pointed out the other six times yields started dropping but then came back up as the Fed continued to raise rates.
- November 2021: Emergence of Covid-19 Omicron variant
- Late February/early March 2022: Russia’s invasion of Ukraine
- May 2022: Rising concerns about the risks of global growth
- July 2022: Global recession fears and weaker-than-expected U.S. inflation
- Late September/early October 2022: Cross-asset selloff, centered on turmoil in the UK
- March 2023: failure of several U.S. regional banks
It might be too early to tell whether rates will remain lower this time around, but seeing how high treasury yields came off, one may feel slightly more confident that a continued pause in rate hikes is more likely this time compared to the six previous times the market rebounded.
What’s ahead in 2024
Looking ahead to 2024, we are skeptical the Federal Reserve will cut rates before the second half of next year unless labor market conditions deteriorate meaningfully, and inflation quickly returns to the Fed’s 2.00% target. Though the market may continue to price in earlier rate cuts, we believe inflation will be just high enough for the target rate to remain unchanged until the back half of next year. If the economic backdrop is expected to slow in 2024, we could see treasury prices rallying significantly throughout the year as the likelihood of dovish monetary policy actions, deterioration in broad credit fundamentals, and a flight to safety drive investors to shift their allocation preferences toward treasuries.
We are also predicting the treasury yield curve will remain inverted for most, if not the entire year. Prices on the long end of the curve may rally by the end of 2024. It will be fun to see if our predictions are accurate or if inflation will prove us wrong.
Fed Funds Features

Source: Bloomberg
Ten-Year Treasury Note

Source: Bloomberg
The first step in the process is speaking with your UMB representative about what the best option is for your bank. Learn how UMB Bank Capital Markets Division’s fixed income sales and trading solutions can support your bank or organization, or contact us to be connected with a team member.
About the authors:
Craig Sutherland is a senior vice president and investment officer at UMB Bank, n.a. Capital Markets Division. He is responsible for helping institutional clients understand how to best manage their bond portfolios and interest rate risk.
Michael Kolb is a vice president and investment officer at UMB Bank, n.a. Capital Markets Division. He is responsible for helping institutional clients understand how to best manage their bond portfolios and interest rate risk.
Steven Winget is a fixed income specialist at UMB Bank, n.a. Capital Markets Division. He is responsible for helping institutional clients understand how to best manage their bond portfolios and interest rate risk.
When you click links marked with the “‡” symbol, you will leave UMB’s website and go to websites that are not controlled by or affiliated with UMB. We have provided these links for your convenience. However, we do not endorse or guarantee any products or services you may view on other sites. Other websites may not follow the same privacy policies and security procedures that UMB does, so please review their policies and procedures carefully.
Disclosure:
This communication is provided for informational purposes only. UMB Bank, n.a. and UMB Financial Corporation are not liable for any errors, omissions, or misstatements. This is not an offer or solicitation for the purchase or sale of any financial instrument, nor a solicitation to participate in any trading strategy, nor an official confirmation of any transaction. The information is believed to be reliable, but we do not warrant its completeness or accuracy. Past performance is no indication of future results. The numbers cited are for illustrative purposes only. UMB Financial Corporation, its affiliates, and its employees are not in the business of providing tax or legal advice. Any materials or tax‐related statements are not intended or written to be used, and cannot be used or relied upon, by any such taxpayer for the purpose of avoiding tax penalties. Any such taxpayer should seek advice based on the taxpayer’s particular circumstances from an independent tax advisor. The opinions expressed herein are those of the author and do not necessarily represent the opinions of UMB Bank or UMB Financial Corporation.
Products, Services and Securities offered through UMB Bank, n.a. Capital Markets Division are:
NOT FDIC INSURED | MAY LOSE VALUE | NOT BANK GUARANTEED


