Over the past few years, we have discussed, at great length, various types of stress tests financial institutions are either requested to perform or are required to perform by examiners. These stress tests are used to enhance the understanding of the underlying risks inherent in their balance sheets. Since the failure of Silicon Valley Bank (SVB) in 2023, we have focused on liquidity stress tests. Recently, we have received requests for more comprehensive stress tests. In this blog, we discuss a comprehensive capital stress test conducted for one of our clients.
Capital stress testing
During a recent exam, a client was asked to perform a comprehensive liquidity stress test with greater restrictions on wholesale liquidity sources and more stress on asset-based liquidity sources. We determined the examiners wanted the financial institution to simulate the impact of an economic recession on liquidity, earnings, economic value and capital.
Our client has experienced significant growth in the past five years, with a higher concentration of loans-to-total earning assets and a shift in the mix of deposits and wholesale funding. Given all the changes to the financial institution’s balance sheet since the last recession, the examiners wanted to know if the risks to earnings, liquidity and capital have changed. The results of these simulations would be used to revise the financial institution’s capital policy and contingency funding plan (CFP).
Economic recession scenarios
We set up two separate simulations to address this request. The first simulation measured the impact of a moderate economic recession, and the second simulation measured the impact of a severe economic recession. We defined the moderate economic recession with the following characteristics:
- Three consecutive quarters of a decline in GDP
- National unemployment rate exceeds 8%
- Property values decline by 5% to 10%
- Federal Open Market Committee (FOMC) cuts Fed Funds target rate to a range of 2.75% to 3.00% over a six-month period
We defined the severe recession with the following characteristics:
- Four consecutive quarters of a decline in GDP
- National unemployment rate exceeds 15%
- Property values decline by 15% to 20%
- FOMC cuts Fed Funds target rate to a range of 0.25% to 0.50% over a six-month period
Before determining how to alter the model assumptions, we first reviewed the financial institution’s historical performance during the last two national recessions. For the moderate recession simulation, we focused on the financial institution’s performance during the COVID-19 pandemic. For the severe economic recession, we focused on the financial institutions’ performance during the financial crisis of 2008 to 2012. We looked at the financial institution’s:
- Non-performing loans (NPLs) as a percent of total loans
- Net charge-offs as a percent of total loans
- The change in loan valuations
- The change in funding levels
- The change in deposit mix (deposit migration)
- The change in earnings ratios.
Using call report data, we reviewed individual loan classifications to determine which loans were impacted the most. The financial institution’s highest concentration of loans resided in the 1-4 family residential mortgage portfolio, but it also maintained above-average concentrations in the agricultural and commercial loan portfolios. Historical call report data revealed that agricultural and commercial loans were impacted the most by economic downturns.
The next step in our process required us to choose between a top-down approach or a bottom-up approach for setting up our model. The bottom-up approach required reviewing individual loans in each portfolio to determine which had the highest risk of becoming non-performing during the recession simulations. We would then conduct a simulation where those loans would become non-performing within the next six months. The top-down approach assumed that a certain percentage of existing loans will become non-performing within the next six months. That percentage was based on the financial institution’s historical non-performing loans to total loans ratio during the recessions mentioned previously.
Given the growth in all loan portfolios over the past few years and a change in the financial institution’s strategic plan for growing the balance sheet, we decided to use the more conservative top-down approach. Since the examiners requested a simulation demonstrating greater stress on liquidity, the non-performing loan assumptions we used were more impactful than the actual historical results.
Moderate recession simulation
For the moderate recession simulation, we altered the interest rate risk model assumptions as follows:
- 20% of agricultural and commercial loans become non-performing over a six-month period (includes agricultural production and construction loans)
- 10% of all other loans become non-performing over a six-month period
- Allowance for loan losses increases each month for the next 12 months
- Net charge-offs increase to 2% of total loans over the next 12 months
- A portion of the investment portfolio is allowed to pay down or mature, maturing U.S. Treasury and U.S. Agency investments are replaced at current yields to maintain sufficient collateral for pledging and borrowing
- No new loans added over the next 12 months
- 50% of all non-maturity deposits and time deposit balances of more than $250,000 are withdrawn from the financial institution immediately
- 20% of remaining non-maturity balances leave the financial institution over the next six months
- Rate sensitivity factors (betas) on non-maturity deposits are reduced by 50% in declining market rate scenarios and increased by 50% in rising market interest rate scenarios. Repricing lags are reduced to zero.
- 20% of existing time deposits are not renewed upon maturity and are not replaced over the next six months
- Existing brokered certificate of deposits (CDs) are redeemed at maturity but not replaced; no new brokered CDs are added
- Federal Home Loan Bank (FHLB) advance borrowing is limited to 50% of the current limit (i.e., 50% haircut on FHLB advance availability)
- Federal Reserve Bank’s discount window is used for any additional funding needs
- Recession rate scenario: Fed funds target rate is assumed to be cut to a range of 2.75% to 3.00% over the next six months, all rates decline, but short-term rates decline faster than long-term rates (i.e., bull steepening)
To gauge the impact on earnings and capital, we compared the stress test simulation results to the Base Case simulation results from our typical, quarterly Rate Sensitivity Analysis. The Base Case simulation assumes no change in market interest rates and no change in the structure of the balance sheet over the next 12 months (assets and liabilities that mature or pay down during that 12-month period are replaced on the balance sheet, in their assigned accounts, at current offering rates and terms).
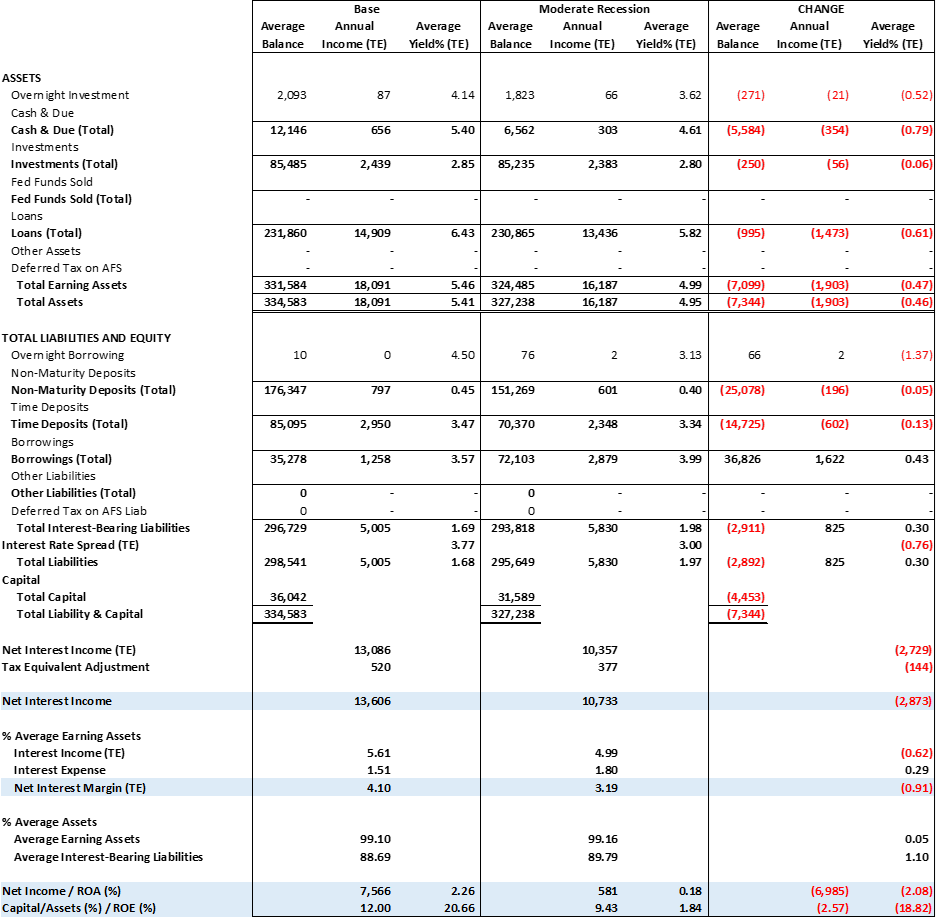
Impact of moderate recession on earnings
Earnings at risk summary: 12-month projection (as of March 31, 2026)

Source: UMB internal data, 2025
Our simulation showed that while the institutions’ earnings would be greatly reduced, they would remain profitable with positive net income and a net interest margin greater than 3.0%. More importantly, the institution would remain adequately capitalized.
Severe recession simulation
For the severe recession simulation, we altered the interest rate risk model assumptions as follows:
- 50% of agricultural and commercial loans become non-performing over a six-month period (includes agricultural production and construction loans)
- 20% of all other loans become non-performing over a six-month period
- Allowance for loan losses increases each month for the next 12 months
- Net charge-offs increase to 10% of total loans over the next 12 months
- A portion of the investment portfolio is sold at current market values, and only U.S. Treasury and U.S. Agency securities are maintained for pledging and collateral for borrowing
- No new loans added over the next 12 months
- 100% of all non-maturity deposits (NMD) and time deposit balances of more than $250,000 are withdrawn from the financial institution immediately
- 50% of remaining NMD balances leave the financial institution over the next six months
- Rate sensitivity factors (betas) on non-maturity deposits are reduced by 50% in declining market rate scenarios and increased by 50% in rising market interest rate scenarios. Repricing lags are reduced to zero.
- 50% of existing time deposits are not renewed upon maturity and are not replaced over the next six months
- Existing brokered certificates of deposits (CDs) are withdrawn immediately, and no new brokered CDs are added
- FHLB advance borrowing availability is reduced to zero (i.e., no access to FHLB funding)
- Federal Reserve Bank’s discount window is used for all additional funding needs
- Recession rate scenario: Fed funds target rate is assumed to be cut to a range of 0.25% to 0.50% over the next six months, all rates decline, but short-term rates decline faster than long-term rates (i.e., bull steepening)
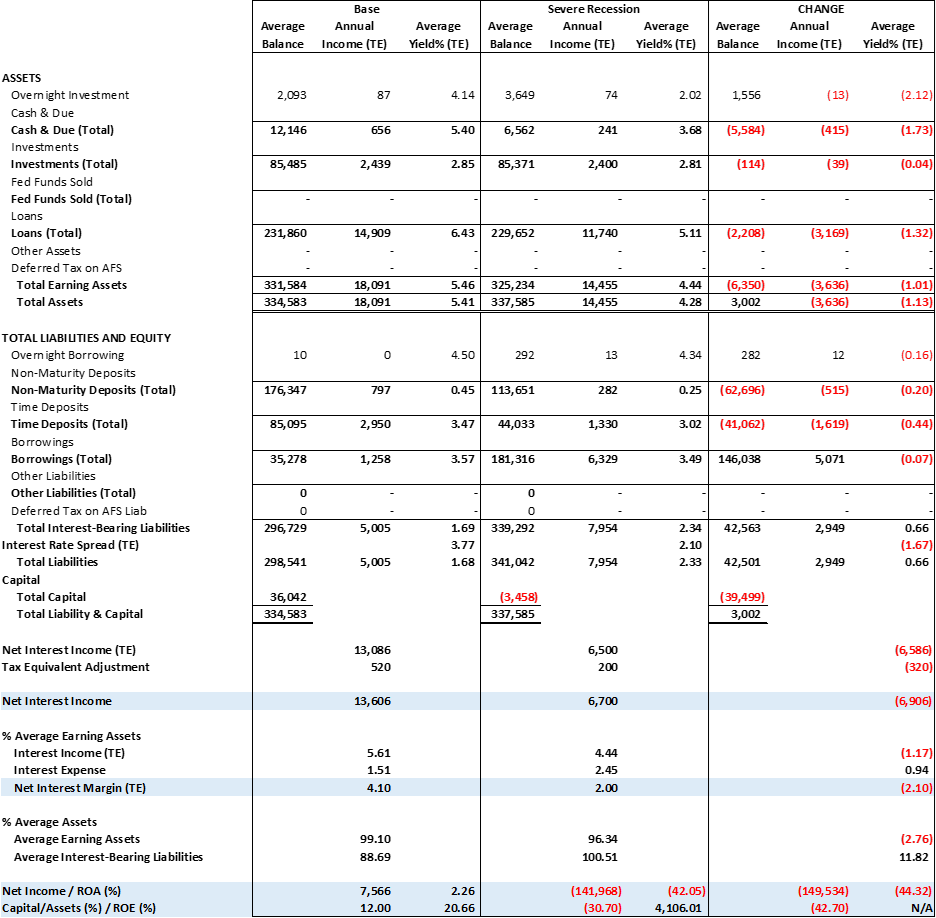
Impact of severe recession on earnings
Earnings at risk summary: 12-month projection (as of March 31, 2026)

Source: UMB internal data, 2025
As the table above shows, the severe recession simulation would cause the institution to lose all its capital and would reduce it to insolvency (Note: This is the 12-month simulation result. The stress test showed that capital declined below adequate levels in month six of the simulation.)
Lessons learned
We learned from the moderate recession simulation that the steps taken by the institution to address the impact of an economic downturn would be sufficient to keep it solvent and profitable. The severe recession simulation showed us that the contingency funding plan would need to be altered, and the institution would need to be more proactive in addressing liquidity needs in a shorter time horizon. In particular, the institution would need to sell more assets, reduce its reliance on wholesale funding, reduce its exposure to volatile deposits, reduce non-interest expense and maintain a higher level of on-balance sheet liquidity to remain adequately capitalized.
Our team of analysts can tailor the assumptions in the stress tests to your institution’s circumstances to provide a relevant assessment of the potential risks.
Learn how UMB Bank Capital Markets Division’s fixed income sales and trading solutions can support your bank or organization, or contact us to be connected with a team member.
Disclosure
This communication is provided for informational purposes only. UMB Bank, n.a. and UMB Financial Corporation are not liable for any errors, omissions, or misstatements. This is not an offer or solicitation for the purchase or sale of any financial instrument, nor a solicitation to participate in any trading strategy, nor an official confirmation of any transaction. The information is believed to be reliable, but we do not warrant its completeness or accuracy. Past performance is no indication of future results. The numbers cited are for illustrative purposes only. UMB Financial Corporation, its affiliates, and its employees are not in the business of providing tax or legal advice. Any materials or tax‐related statements are not intended or written to be used, and cannot be used or relied upon, by any such taxpayer for the purpose of avoiding tax penalties. Any such taxpayer should seek advice based on the taxpayer’s particular circumstances from an independent tax advisor. The opinions expressed herein are those of the author and do not necessarily represent the opinions of UMB Bank or UMB Financial Corporation.
Products, Services and Securities offered through UMB Bank, n.a. Capital Markets Division are:
NOT FDIC INSURED | MAY LOSE VALUE | NOT BANK GUARANTEED


