It is perhaps universally accepted that the Federal Open Market Committee (FOMC) is embarking on an interest rate hiking cycle in 2022, starting with the March 16 decision. The Federal Reserve (Fed) Chair Powell’s recent remarks to Congress confirm that expectation.
While there are potential negative outcomes with Russia that could change that course between now and then, we should all hope and expect that the world does not suffer those events and a hiking cycle beginning with a March 16 hike is a foregone conclusion.
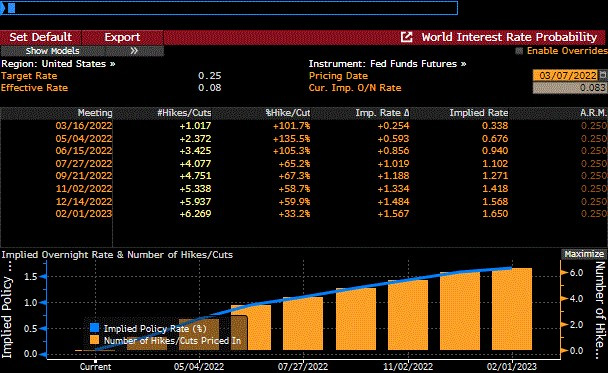
However, in recent days, investors may have whiplash from watching yields fall as expectations of the pace of future hikes change dramatically. The market is now expecting the FOMC to hike rates approximately five to six times in 2022, in response to the strongest inflation readings that the U.S. has seen in decades. This is down from a mid-February expectation of 6 to7 hikes in 2022.
Source: Bloomberg
With all the volatility in markets and geopolitics, it’s important to remember that the core of the Fed’s dual mandate is what will drive policy. The FOMC is charged with promoting maximum employment while maintaining price stability. As the world reemerges from two years of COVID restrictions, taking stock of where we currently stand is important. The employment side of the equation has almost completely recovered to pre-COVID levels. Both U-3 and broader U-6 unemployment rates are consistent with 2018 and 2019 levels, and, more importantly, are consistent with (or perhaps even lower than) the Fed’s historical non-accelerating inflation rate of unemployment (NAIRU) estimates.
What has changed relative to 2018 and 2019 is the inflation side of the picture. For the past decade plus, the FOMC has openly contemplated allowing inflation to run higher than its long-term 2% goal in the short-to-medium term, judging that deflation and a liquidity trap were greater risks. As we observe inflation readings far above target, the current debate is not around inflation versus deflation, but whether inflation will naturally moderate or require aggressive monetary policy action to correct.
So far, the monetary policy hawks are winning. The FOMC’s recent dovish argument that high inflation will be transitory appears to be misguided. As a result, markets are now expecting a more aggressive Fed than we have seen in some time, with inflation stubbornly forcing the FOMC’s hand. Many economists forecast slowing growth in the second half of 2022, and there is some risk that the FOMC will continue to hike rates, even in the face of declining growth rates.
If inflation does not subside and growth does deteriorate, there is a further risk that the FOMC hikes rates enough to cause a mild recession, an outcome that is not without precedent. A closer look at the rate curve can help us evaluate this risk and the implications for fixed income portfolios a little further.
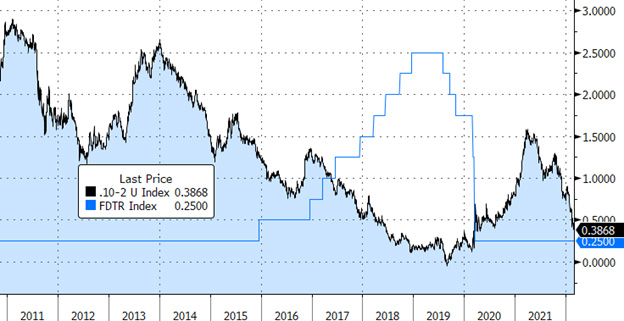
The following chart illustrates a common interest rate pattern that appears to be repeating. The black line represents the spread between the 10-year U.S. Treasury and the 2-year U.S. Treasury.
For instance, if the 10-year is 1.50% and the 2-year is 0.25% the 10-2 spread is 125 basis points (bps)— and a fairly steep curve at that, quite different from the current curve which is increasingly tight.
10-2 Spread vs Fed Target Rate (Upper)
Source: Bloomberg
Routinely, the Fed will hike more aggressively than is warranted by the market’s economic outlook. The short tenor of the curve is driven directly by the expectations of future FOMC actions and the longer tenor of the curve is much more focused on correctly appraising economic opportunity. As a result, when there are doubts regarding the domestic economy while the market is pricing in future FOMC hikes, we will see a flat curve. The worst part of a flat curve is a distorted risk/reward relationship.
Essentially, the shorter duration instruments (less risk) are compensating the investor the same amount as the longer duration instruments. This inevitably results in very short duration investment activity that is ultimately reinvested while the economy is in a recession and the entire curve is lower than it was previously. Hence, the importance of portfolio structure in both steep and flat curves.
Often, the typical bank portfolio will be a ladder from point zero to the longest duration palatable by the bank’s board and management team. There are many strengths to such a ladder, particularly when liquidity is the primary priority. However, on some balance sheets, the focus is interest income that supports liquidity as well.
In this flattening curve environment, we encourage an approach that starts with your entire balance sheet in mind, which includes both short and longer duration instruments and a diversity of credit exposures, avoiding a concentration in any one sector.
During the past two years, monetary policy amidst the pandemic brought a return to the zero lower bound. As you are likely too aware, the yields across the curve plummeted like a rock to historic lows. It was not uncommon to extend duration in order to book even somewhat palatable yields. This was evident across the financial sector as institutions gradually extended their duration.
Now, with the return of yields closer to the historical norm and certainly north of the pre-pandemic all-time lows, there is an opportunity to book shorter duration instruments without detrimentally affecting your interest income, or at least not nearly as much.
Hence, we continue to see the barbell approach to security selection adding value to institutional balance sheets. In fact, given what occurred during the pandemic – specifically related to duration – it is possible to tilt the barbell towards a 60/40 emphasis on the near term maturities with an overall effect of balancing the barbell closer to a 50/50 split when the last two years of purchases are included. Thus, the longer duration yields are balanced by the shorter duration liquidity resulting in a nimble portfolio that avoids overemphasizing the two-year reinvestment window.
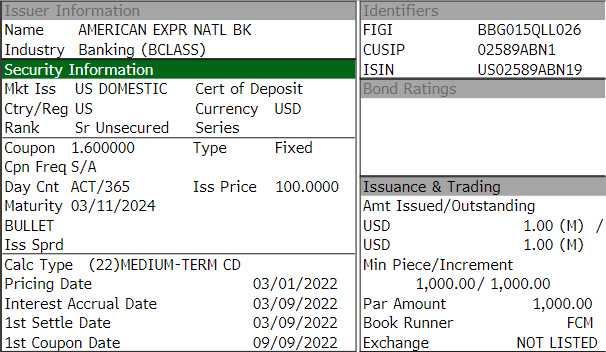
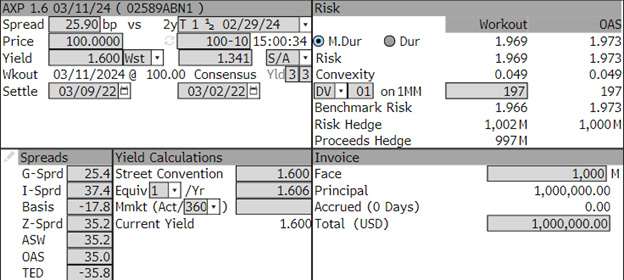
This American Express investment CD is an excellent example of a short duration instrument with spread. Only recently are we seeing CDs return the positive spreads that characterized the sector for much of the 2010s.
| Issuer | Maturity | Call | Coupon | Price | Spread |
| AmEx | 2024 | n/a | 1.60 | 100 | 25.9 |
Source: Bloomberg
On the longer tenor of the barbell, this Mahtomedi ISD is a GO Unlimited, boosted by one of the strongest enhancements in the Midwest and provides a tax equivalent yield well over 2.00%. The 2.00 coupon to some may be a “no go” and to others who are more cautious regarding premiums will be a key attribute.
While high coupons protect against market movements such as the first quarter 2022, the lower amortization can be advantageous, too, especially as it relates to mortgage-backed securities.
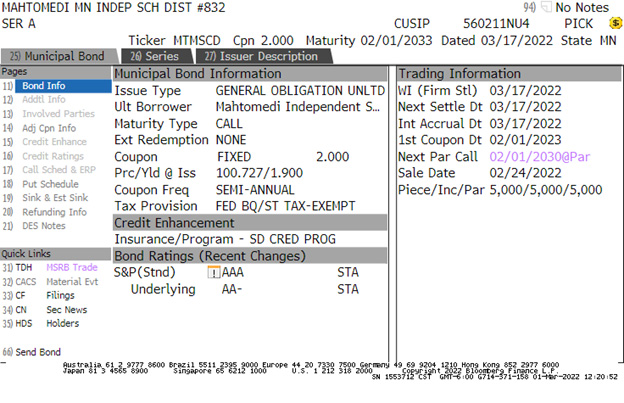

Source: Bloomberg
It’s no secret that rising rate environments have typically been challenging for fixed income investors. For many, the gut reaction is to aggressively shorten portfolio duration, specifically through focusing new investment activity on the short end of the curve. And while continuing to buy short-duration assets absolutely makes sense, it is important that investors not completely neglect the long end of their portfolios and remain balanced in their approach.
Learn how UMB Bank Capital Markets Division’s fixed income sales and trading solutions can support your bank or organization, or contact us to be connected with a Capital Markets Division team member.
This communication is provided for informational purposes only. UMB Bank, n.a., UMB Financial Services, Inc. and UMB Financial Corporation are not liable for any errors, omissions, or misstatements. This is not an offer or solicitation for the purchase or sale of any financial instrument, nor a solicitation to participate in any trading strategy, nor an official confirmation of any transaction. The information is believed to be reliable, but we do not warrant its completeness or accuracy. Past performance is no indication of future results. The numbers cited are for illustrative purposes only. UMB Financial Corporation, its affiliates, and its employees are not in the business of providing tax or legal advice. Any materials or tax‐related statements are not intended or written to be used, and cannot be used or relied upon, by any such taxpayer for the purpose of avoiding tax penalties. Any such taxpayer should seek advice based on the taxpayer’s particular circumstances from an independent tax advisor. The opinions expressed herein are those of the author and do not necessarily represent the opinions of UMB Bank, n.a., UMB Financial Services, Inc. or UMB Financial Corporation.
Products offered through UMB Bank, n.a. Capital Markets Division and UMB Financial Services, Inc. are:
NOT FDIC INSURED | MAY LOSE VALUE | NOT BANK GUARANTEED


