
Asset allocation is a crucial component of wealth management strategy. In Determinants of Portfolio Performance‡, a 1986 paper by Gary Brinson, Randolph Hood and Gilbert Beebower, the authors state that the vast majority of expected return is driven by asset allocation. That may come as initially counterintuitive when one considers the great variability of year-to-year returns for individual stocks.
Although a number of fortunes have been created by concentration of assets, a far greater number of fortunes have been lost by failing to diversify concentrations. Harry Markowitz, father of modern portfolio theory, famously said, “Diversification is the only free lunch in finance.” Strategic asset allocation is one of the main determinants of expected returns.
Understanding Asset Allocation
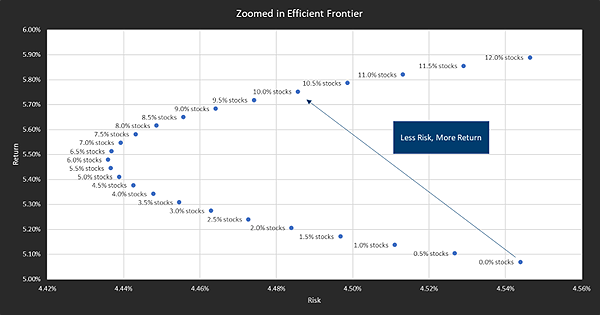
Asset allocation refers to the distribution of assets across different asset classes, such as stocks, and bonds. Each of these asset classes have different risk and return characteristics on their own, and they have different interactions between them. The process of asset allocation requires you and your financial team to establish an expectation for returns, risk (the variability of those returns), and correlation (or the relative co-movement of return between the various asset classes). Once the expectations are established, the goal is to maximize the return for each given the level of risk.
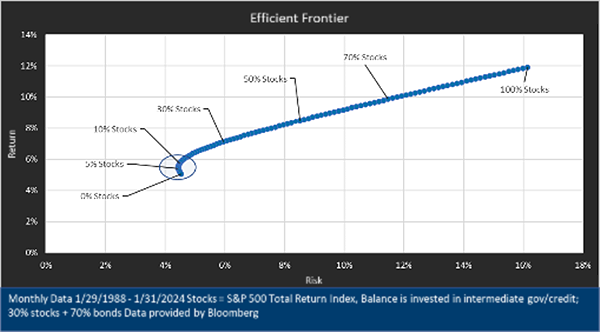
As an investor, your financial team can help you establish an allocation which achieves the correct balance of risk and return for you. As an investor, you need to consider your risk tolerance, investment horizon, and financial objectives when determining your asset allocation strategy.
Strategic Asset Allocation:
Strategic asset allocation establishes the composition of long-term investment risks, and thereby returns. By defining long term allocations among various asset classes, it is often viewed as the baseline or neutral position for a portfolio. This contrasts with tactical asset allocation, which seeks to take advantage of short-term opportunities (market imbalances) that may present from time to time. Investors must consider their risk tolerance, investment horizon, and financial objectives when determining their strategic asset allocation. Your financial team will discuss how each influences results when thinking about a strategic approach to investing.
Generally, risk tolerance is more of a feeling, than being objectively measurable. The reason it’s so important is that emotions can lead to terrible decision making in the moment, and historically the best time to take on additional risk is when it hurts the most.
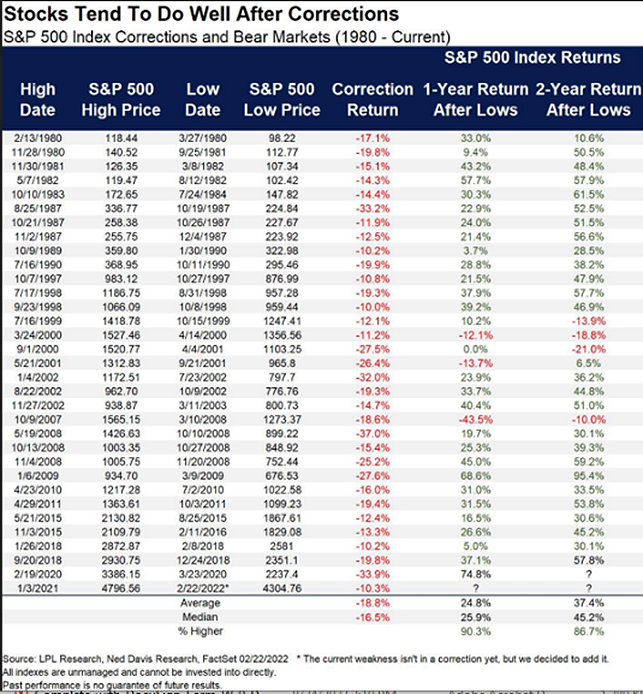
Since 1980, the stock market has been positive 90% of the time 12 months after a correction. The average correction was -18.8% and the average one-year return following that is 24.8%. Had an investor bought stocks right before the average correction, so long as they continued to hold those stocks through the recovery, they made money on their investment.[1]
It is easy to have an intellectual understanding that over time, markets go up and that “it’s time in the market, not timing the market” that counts; however, the behavioral reaction to losses are often intense. The documentation and study of this idea led Daniel Kahneman to a Nobel Prize in 2002 for a theory known as “prospect theory,” which details the emotional toll losses take on people vis-à-vis the emotional benefit of profits. The theory roughly states that losses are twice as painful as gains are pleasurable.
That’s why understanding someone’s risk tolerance before any risks are realized is of paramount importance. The discovery that you’ve taken more risk than you can handle after that risk has been realized causes permanent impairments to capital.
Financial planning meets asset allocation
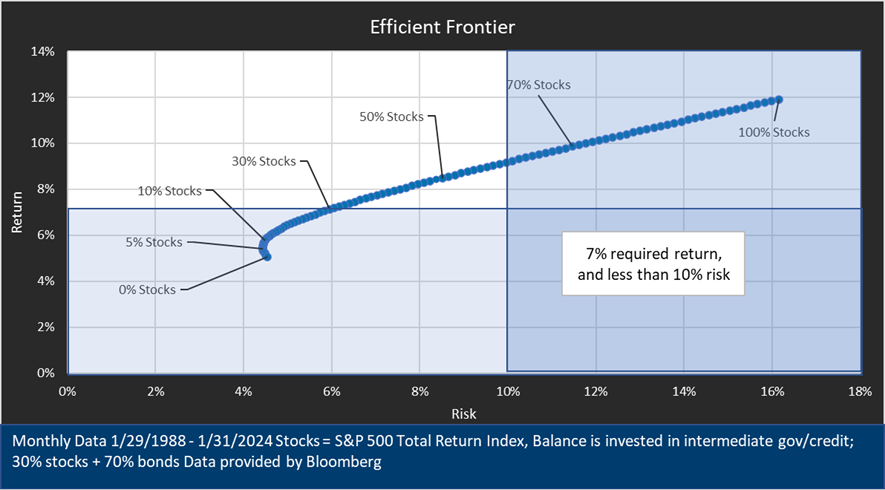
This is where financial planning and investment management meet. A financial plan allows you to establish the minimum risk required to meet your goals leading you to a final allocation. If for example your financial needs require a 7% rate of return to meet your goals, and you decide that anything more than 10% variability in returns would be too much risk for you to bear, then your preferences dictate the range (in this example) between roughly 30% and 60% stocks that will make up your strategic asset allocation. The important part is that once you establish a strategic asset allocation, you maintain that through time. Time plus the implementation of a consistent process is the recipe for financial success.
The most important thing that we can do is specifically define time frames and invest accordingly. The reason that this is so important, is volatility dissipates over longer time horizons. As an investor expands their holding period the variability of results falls, which should make some intuitive sense because the overall long-term path of asset prices is positively sloped. In all the prior charts, we have shown results based on one year holding periods for stocks and bonds; however, most investors will hold investments for many years, not just one.
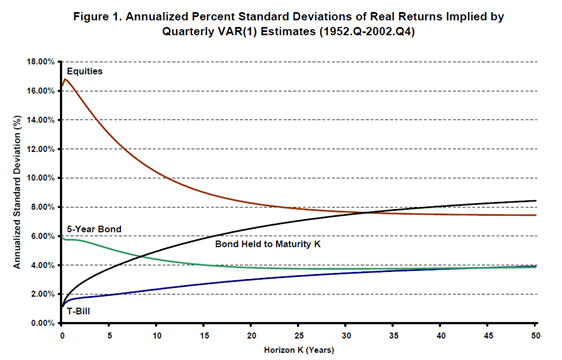
Perhaps counterintuitively, assets like stock and bond indexes become less volatile, or less risky, with time. With lower risk, as measured by variability or standard deviation of returns, the more predictable outcomes become.
Strategic asset allocation is a critical aspect of investment management, enabling investors to build diversified portfolios that align with their financial goals and risk tolerance. Dedication to the principles of strategic asset allocation will help investors avoid the behavioral pitfalls that arise during short-term market disruptions.
By understanding the principles, strategies, and factors influencing asset allocation decisions, investors can navigate market uncertainties and achieve long-term success in their investment journey.
Interested in learning more about Private Wealth Management? With UMB, you have a guiding partner from financial advising and investment portfolio management, to wealth-building strategies and retirement and legacy preservation plans.
[1] Starting with $1, the loss of 18.8% leaves you with $0.812. Keeping 0.812 invested for the following return on average of 24.8% $0.812 * 1.248 = $1.01.
When you click links marked with the “‡” symbol, you will leave UMB’s website and go to websites that are not controlled by or affiliated with UMB. We have provided these links for your convenience. However, we do not endorse or guarantee any products or services you may view on other sites. Other websites may not follow the same privacy policies and security procedures that UMB does, so please review their policies and procedures carefully.
This report is provided by UMB Trust & Investment Services a division of UMB Bank, n.a. for informational purposes only and contains no investment advice or recommendations to buy or sell any specific securities. Statements and projections in this report are based on the information provided by the client or third parties, and available as of the date this report was published. UMB Trust & Investment Services obtained information used in this report from third-party sources it believes to be reliable, but this information is not necessarily comprehensive, and UMB Trust & Investment Services does not guarantee that it is accurate. All investments involve risk, including the uncertainty of dividends, rates of return and yield and the possible loss of principal. Past performance is no guarantee of future results.
The S&P 500 Index is unmanaged, consisting of a market capitalization-weighted index of 500 common stocks. It is not possible to invest directly in an index.
You should not use this report as a substitute for your own judgment, and you should consult with professional advisors before making any tax, legal, financial planning or investment decisions. This report contains no investment recommendations, and you should not interpret the statements in this report as investment, tax, legal, or financial planning advice.
Neither UMB Trust & Investment Services nor its affiliates, directors, officers, employees or agents accepts any liability for any loss or damage arising out of your use of all or any part of this report.
“UMB” — Reg. U.S. Pat. & Tm. Off. Copyright © 2026. UMB Financial Corporation. All Rights Reserved
Securities offered through UMB Private Wealth Management, LLC (UMBPWM), an SEC registered investment adviser, and UMB Trust & Investment Services, a division within UMB Bank, n.a.
Banking services offered through UMB Bank, n.a.
Insurance products offered through UMB Insurance, Inc.
UMBPWM, UMB Bank and UMB Insurance are affiliates and wholly owned subsidiaries of UMB Financial Corporation.
You may not have an account with all of these entities. Contact your UMB representative if you have any questions.
SECURITIES AND INSURANCE PRODUCTS ARE:
NOT FDIC INSURED • NO BANK GUARANTEE • NOT A DEPOSIT
NOT INSURED BY ANY GOVERNMENT AGENCY • MAY LOSE VALUE