To save or forward a copy of this post, download it here.
October economic review
Current data looks quite good for the U.S. economy. Throughout the third quarter of 2023, the economy continued to show incredible resilience, despite the aggressive tightening campaign unleashed by the Fed over the last year. Economic data has come in consistently above economists’ forecasts, with the U.S. consumer continuing to spend in a manner that is keeping the economy moving along quite nicely. In response, the Fed has become steadily more “hawkish” in their tone, pointing to very strong labor markets and core inflation numbers that are moving lower at a very slow pace.
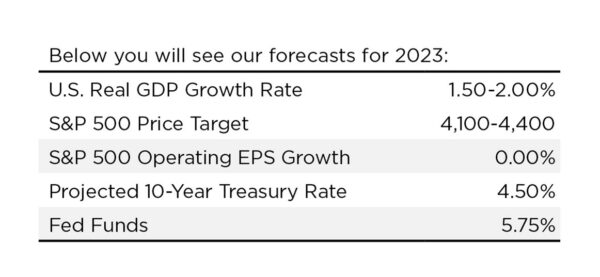
The Fed is concerned enough about recently robust economic activity that they are projecting a strong likelihood that they will execute another increase in rates in the next few months, taking overnight rates to 5.75%. The Fed has also bolstered their commitment to keep rates higher for longer in order to ensure that inflation will move from 4.50-5.00% current readings back down to their long-term target range of 2.00–2.50%.
But, on the other hand, several of the shorter-term leading indicators for both the economy and inflation are showing signs of weakness. Additionally, the two tried-and-true long-term indicators of recession, the LEI Index and the treasury slope, are firmly in recessionary range. We are now stuck facing a steady stream of quite strong current economic indicators, but also beginning to see signals that things may be set to slow meaningfully. The Fed is grappling with this mixed bag of data and pledging to remain “data dependent” while they hold rates at elevated levels. This challenging environment led investors to harvest some profits during the quarter and put pressure on stock prices (YTD returns are still quite strong).
The Fed will be looking for clear signs that core inflation is falling towards their target before they’re willing to signal a pivot towards a softer tone and lower rates. Of course, inflation can only come down if the economy cools off somewhat. Investors need to prepare for a protracted period of choppy markets that is likely to unfold as the Fed stays on hold while the world reacts aggressively to any data point that is even modestly askew of expectations.
Inflation may lower in 2024
It appears the Fed is very near the end of their rate hikes, but inflation isn’t yet moving consistently lower. Inflation sent mixed signals throughout the third quarter, with Core CPI continuing to grind slowly lower, but headline CPI moving slightly higher. The Fed’s primary inflation indicator, Core PCE, also ticked slightly higher during the third quarter. Recently, their focus has moved to a special measure of “Supercore Inflation” (PCE core services less housing), which also moved unexpectedly higher at the last update. At the most recent meeting, Fed officials reacted to the recent resilience in the inflation data by indicating they may make one more upward adjustment to rates later in the year, and also that they will hold rates at the higher levels for most of next year.
“Higher for longer” became the over-riding theme as the third quarter of 2023 ended. But, on the other hand, some leading indicators are signaling that inflation numbers should be headed lower as we move into 2024, which could lead the Fed to pivot towards lower rates more quickly than they are currently forecasting. The financial markets are clearly positioned for an earlier move into easing mode, likely some time next summer.
Soft landing still on the table
The Fed is forecasting a soft landing for the U.S. over the next 18-24 months—with inflation falling to target without a meaningful increase in unemployment. This outcome is virtually unprecedented in the U.S. Unemployment typically doesn’t move gently higher and then stabilize, but instead it usually continues to rise to a more severe (recessionary) level. If the Fed reacts perfectly during the upcoming cycle, pivoting towards lower rates just in time to stop us from falling into recession, then a soft landing is possible.
While we believe that this is a possible outcome, we do not have high conviction that it will occur. It is equally probable that other scenarios could cause unemployment to move above the Fed’s target as we fall into a recession—although it would most likely be mild and short-lived.
Economic outlook and our forecast
We believe the probabilities are nearly evenly distributed across multiple outcomes over the next 24 months—the least likely of them being a perfect soft landing. Current economic activity looks robust, but the early warning signs are beginning to appear that a slowdown is coming our way. A modest, controlled slowdown is what the Fed is aiming for, but that outcome has proven elusive over the last several decades. We believe the risks are tilted to the downside.
Risks to consider:
- Core inflation could get stuck in a range well above Fed target (stuck at 3.5% or higher). This would force the Fed to engage in another round of tightening and would push rates higher than either the economy or markets are expecting—leading to a more severe recession.
- There is also a not-insubstantial risk that higher interest rates are only now beginning to bite into economic activity, and we could already be on the path towards a mild recession.
These two outcomes are both reasonably probable, and both result in a more negative outcome for the economy (versus soft landing). We remain cautious, with a neutral allocation to risk assets.
Financial Markets
Fixed income outlook
With the inflation story keeping the Fed on high alert, the Fixed Income markets have been steadily preparing for overnight rates to stay “higher for longer”. This has caused intermediate and long-term rates to grind higher over recent months. The 10-year treasury has reached a multi-year high (4.50% at the time of this writing), with the bond market preparing for a longer waiting period before the Fed pivots towards lower rates. Despite recent rate movements, the Treasury curve is still deeply inverted—long rates are dramatically lower than overnight rates. This indicates that the bond market believes that both inflation and overnight rates are headed lower over coming quarters. The inversion of the treasury curve is the most dramatic and long-lived inversion we’ve seen in the last four decades. Treasury markets have been indicating slower growth and lower rates for more than a year—and we currently agree that they will finally be correct as we move through 2024.
We believe the peak in both overnight and longer-term rates is likely near. We are probably very close to the cyclical peak in rates, which could set the stage for very strong fixed income performance over the next several quarters. As long as inflation doesn’t re-surge and push rates meaningfully higher, then we can be reasonably confident that we will recognize at least the starting yield for bond portfolios (5.00%+ in most cases) and may collect additional total return if rates start to fall.
After more than a decade of underweight status, it is highly advisable to consider moving back into full fixed income weightings within portfolio allocations. Additionally, within our fixed portfolios, we have added to duration in order to protect income streams and potentially add to total returns if rates start to fall.
Credit markets are a possible yellow flag within the fixed income space at this time. Given the early signals of economic slowdown, yield spreads in the High Yield space do not appear to properly compensate investors for the possible increase in defaults that may be coming our way. We have cut exposure to neutral and are considering moving to underweight in this space.
Equity outlook
On the one hand, the recent surge in treasury yields has lowered demand for risk assets. This spike in yields caused the S&P 500 to suffer back-to-back monthly declines as investors adjusted to a world where rates sit at levels not seen in more than a decade. Leading the way down for equities were yield proxies like utilities and real estate and profitless technology companies, a group whose lofty valuations have become harder to justify as investors turn to other asset classes for returns. Stocks had been able to withstand higher rates for months as investors flocked to big tech firms riding the wave of AI. But the latest move in Treasuries, sparked by the Federal Reserve’s signal that policy rates will remain elevated well into next year, has caused some investors to reconsider their positioning.
On the other hand, stock bulls can point to last October, when a similar surge in yields sent the S&P 500 to its bear-market low. That is before the S&P 500 index then rallied the first seven months of the year and is still 21% above that 2022 low. The argument from the bulls is that prior runups in yields during the Fed’s tightening cycle have been short-lived. Every time the 10-year yield has climbed above 4% in the past year, it’s retreated back below 3.5% in short order.
Stock bears argue this time is different, with Fed officials now split on whether they’ll need to raise rates one more time this year—and in agreement that any cuts won’t come until well into 2024. Elevated yields could slow investment broadly by increasing borrowing costs, while also threatening the recent resurgence in stocks by increasing the appeal of bonds as a safe alternative.
Historically the critical signal has been if the 10-year yield climbs to at least 4.5% or higher and stays there for a sustained period—which often forces the re-calibration of equities with higher valuations. Technology companies are particularly susceptible to fears of rising rates because many of them are valued on lofty projected profits delivered many years in the future.
The good news for stocks is that the end of Fed rate-hiking cycles has historically marked peak tightness in financial conditions, which becomes a tailwind for stocks and other risk assets. However, that tailwind only persists if a hard landing (recession) is averted. For now, many scenarios still remain on the table, and is why we continue with our theme for equities in the back half of the year…more market chop, less market top…caution is warranted.
Third quarter economic data update
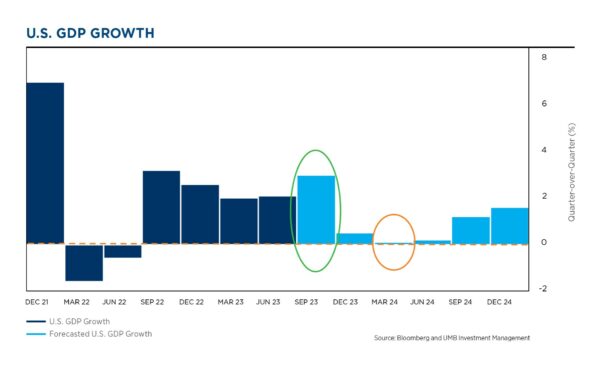
- Third quarter GDP looks to be quite robust, with estimates running as high as 4%. It is nearly certain that activity will slow meaningfully during the fourth quarter.
- The slowdown should continue into 2024, with a rebound in activity during the back half of the year.
- It is possible that GDP could fall into negative territory in 2024, which would likely include a meaningful increase in unemployment, and therefore a recession.
- A possible recession would most likely be mild and short-lived.
- Overall, even with a mild recession, we still expect positive overall GDP growth for calendar year 2024.
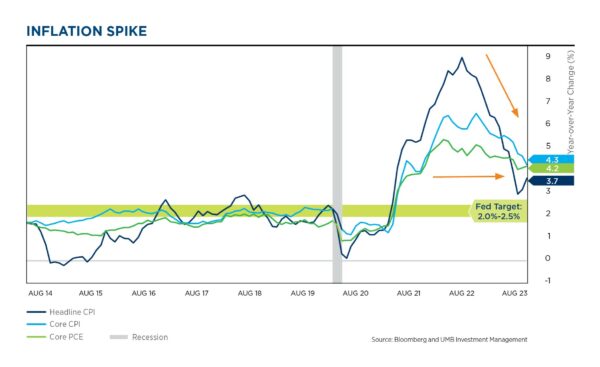
- Inflation remains the focal point for the Fed and the economy.
- The dark blue line shows headline CPI, the most-commonly quoted inflation measure. This number has been falling quickly, leading many investors to ask why the Fed continues to raise rates. However, it moved up at the last update.
- The primary reason for the Fed’s ongoing inflation concerns is illustrated by the green and light blue lines, Core PCE and Core CPI, the Fed’s preferred measures of inflation.
- While headline inflation has been falling quickly, it has moved up in recent reports. PCE data have been moving very slowly lower but are still well above the Fed’s target of 2.0%–2.5%.
- The Fed will remain tough as long as inflation looks to be stuck above their target range. The Fed may increase rates again, and then is expected to hold rates at higher levels for a good portion of next year.
Inflation: One key measure not behaving, but others are encouraging
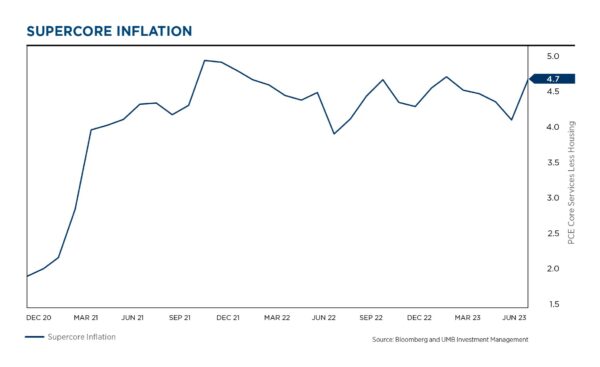
- The Fed has recently begun to focus on one of the “Supercore” inflation numbers, Core PCE Services Less Housing.
- Chairman Powell believes this is perhaps the best indicator of Inflation for the current structure of the U.S. economy. Our system is primarily Service based—with services comprising nearly 70% of economic activity.
- This Inflation indicator has been quite “sticky”—churning along at roughly 4.50%, and even moving higher at the last update.
- The Fed will want to see steady downward movement in this variable before they are likely to pivot their messaging towards lower rates.
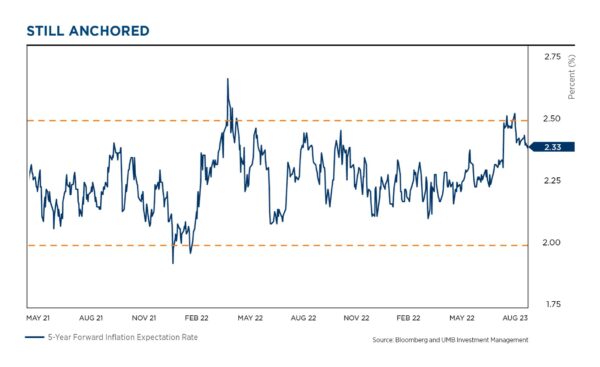
- The inflation expectation futures market has said all along that inflation will come back down to Fed targets. This matches the signals coming from the bond market.
- Shown here are 5-year forward inflation expectations, a key datapoint the Fed follows, which indicates the outlook for inflation 5-years from now.
- While expectations spiked up a bit last year when we saw our first inflation scare, it has since settled down and is now holding steady in the middle of the long-term Fed target.
- The financial markets are indicating that the Fed will succeed in bringing inflation down to their target zone. Whether or not this includes a recession is unclear, but the markets are firmly aligned with the idea that the Fed is on the path to controlling inflation.
Fed actions: On the one hand, rate increases look dramatic
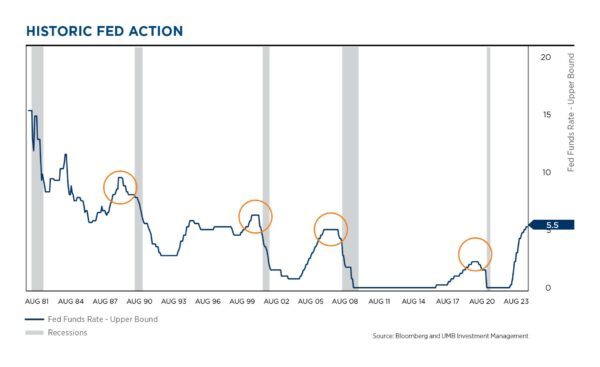
- Typically, late in the economic cycle, inflation often is heating up and the Fed hikes rates to cool the economy down. At some point, the Fed will pause their tightening campaign, because interest rates work with a long lag effect—they need time to see how quickly the economy will cool off.
- After a severe tightening cycle, the economy then typically falls into a recession.
- It could be different this time, but the steepness of the increase in the current tightening cycle is a big reason why many forecasters have been fearful of impending recession.
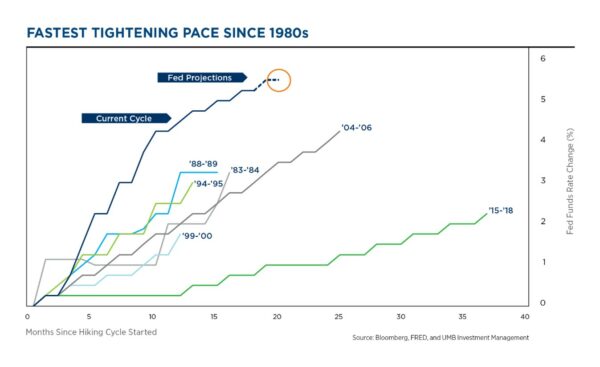
- The time period from ’15–’18 (dark green line) was a cycle where the Fed was not fighting an inflation problem. They were merely trying to normalize rates. In the other five cycles, the tightening was all directed at reigning in Inflation.
- The dark blue line shows the current cycle—much quicker and much steeper than previous cycles. This time the Fed has been fighting a more dramatic increase in Inflation.
- Despite the steepness of this cycle, the Fed does not yet know if they’ve done enough to bring Inflation down to their target range—more work may be needed.
Fed actions: One the other hand, real rates are not as high as previous cycles
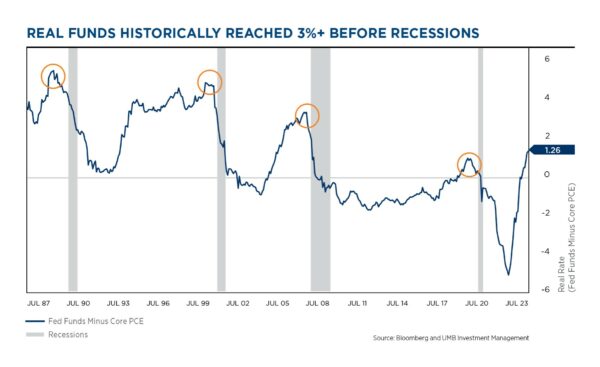
- The Fed prefers to track the movement of real rates…subtracting Inflation from the nominal Fed Funds rate to determine the Real Fed Funds rate.
- While the current Fed hiking cycle has clearly been quicker and steeper than in the past, this chart shows that, in real terms (adjusted for inflation), the Fed has been less aggressive than previous cycles.
- In the previous three cycles (excluding the pandemic—not a normal economic cycle) the Fed took real rates up to 3%–5%…compared to today where they sit just above 1%.
- The Fed believes that real rates may not have become overly restrictive yet, therefore they are considering another upward adjustment and intend to keep rates elevated for quite some time.
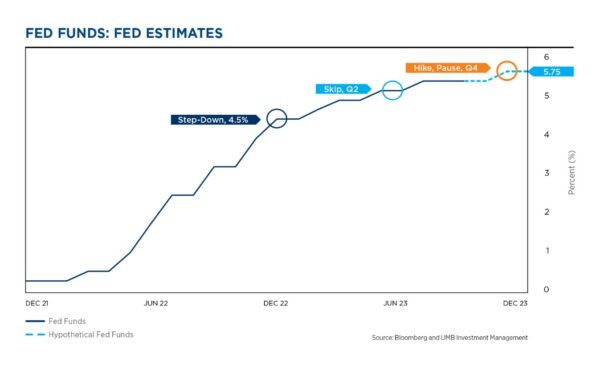
- We believe the Fed is very near the end of its hiking cycle.
- They remain on hold for now, but are indicating another increase is likely.
- We continue to believe that inflation will soften moving into next year.
- Given our forecast of a slowing economy and inflation subsiding, we anticipate that the Fed will begin to lower interest rates in late 2024.
- If the slowdown comes sooner than expected, the Fed could pivot into easing mode earlier in 2024.
- The long and uncertain lag effects for interest rates make the upcoming economic cycle one that could follow several different paths. Caution is warranted.
Economic fundamentals: Labor market
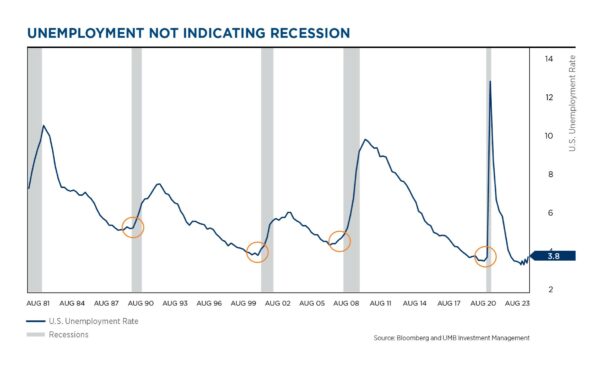
- On the one hand, Unemployment indicates a very strong labor market.
- The labor market is not currently showing any signs of recession or even a slowdown.
- We must remember that Unemployment is not a leading indicator.
- Headline unemployment typically starts to rise as we enter a recession. We have yet to see a meaningful increase in unemployment, and we currently sit at historically low levels.
- If people are gainfully employed, they typically don’t change their consumption behavior, and consumption has been the driver of our recent economic strength.
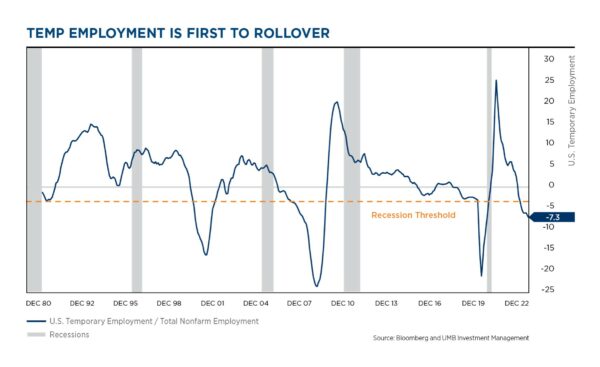
- On the other hand, Temporary Employment signals that Unemployment will rise.
- One of the early indicators of softness in the labor market is Temporary Employment.
- Temporary Employment has been declining steadily for quite some time, which typically indicates that the overall job market is weakening. Temp workers are the first to be cut when employers are trying to reduce costs or are dealing with softening demand. This often precedes increases in the broad Unemployment rate.
- The recent trends in Temporary Employment indicate that the broad labor market may be weaking, and the Unemployment rate is likely to rise over coming months/quarters.
- The Unemployment rate has been quite difficult for the Fed to manage historically, with modest increases typically turning into more severe increases.
Economic fundamentals: Two major indicators are signaling slowdown
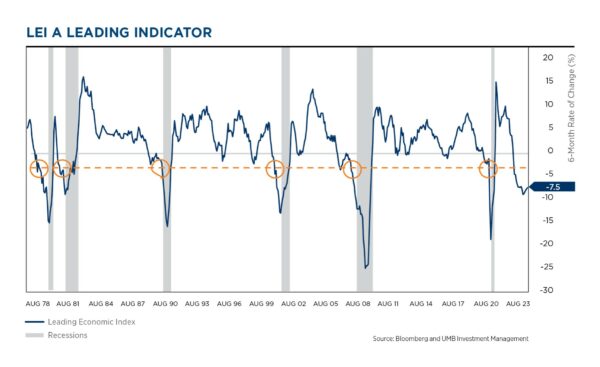
- The six-month rate of change in the Leading Economic Index (LEI) is one of the most widely followed recession indicators because of its almost perfect track record of forecasting looming recessions.
- Historically, when the six-month rate of change crosses -3.5%, a recession is imminent.
- The index currently stands at -7.5, which supports our annual theme of a bumpy landing.
- Given that the index broke below the critical threshold last year, we would not be surprised if our economy encounters a mild recession sometime in the next 9-12 months.
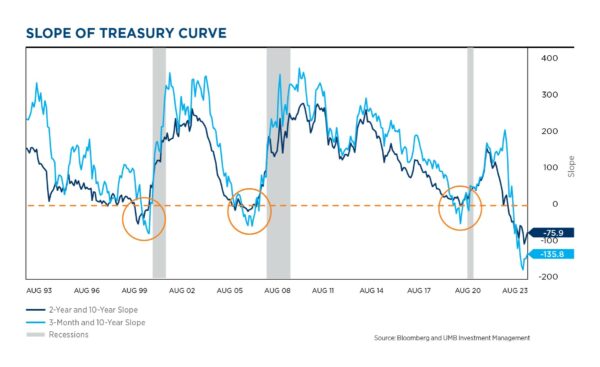
- Historically when we’ve seen inversions in the yield curve (orange circles), the Fed has stopped hiking. In this hiking cycle the Fed continued to hike interest rates long after the yield curve (Fed Funds to 10-year Treasury) became inverted.
- In this hiking cycle, the Fed was only in the early stages of tightening when the yield curve inverted, causing the inversion to become quite severe.
- The continued inversion of the yield curve is a good indicator that a recession is likely in the next 6-12 months. The bond markets are positioned for both inflation and rates to fall throughout 2024.
- It seems highly likely that rates will fall in 2024. An outright recession isn’t certain, but it is a risk.
Financial markets
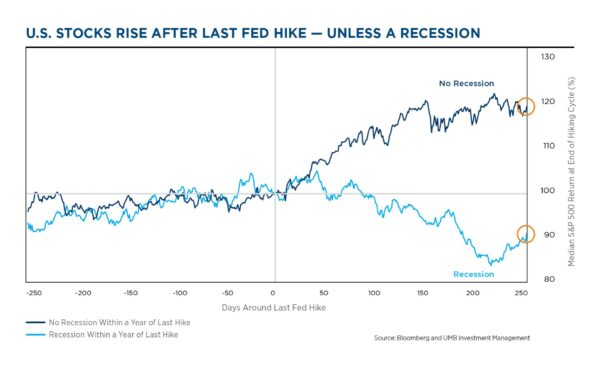
- The S&P’s gradual rise toward the end of hiking cycles becomes a more rapid increase when it’s clear rates have peaked, but a recession is the big possible detractor.
- Hiking cycles that were quickly followed by recession within the next year have a clearly harsher outcome for equities than those that do not.
- Recessions have historically overwhelmed any positive effects from looser financial conditions (Easing from the Fed), and coincided with a weakening in the stock market.
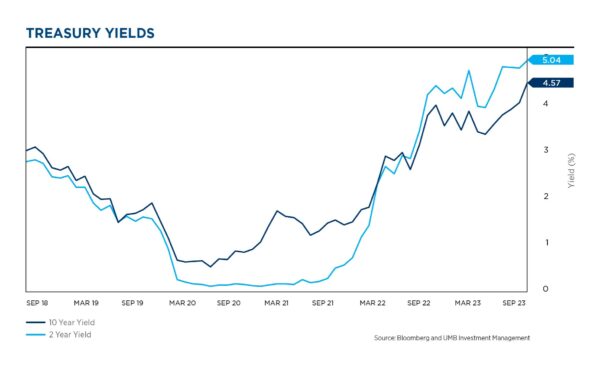
- The longer portions of the treasury market have risen over recent months, due to the strong messaging from the Fed. Bond investors are positioning for a longer waiting period before the Fed pivots toward easing.
- However, long term rates are all still well below current overnight rates (the inverted yield curve we spoke about previously in this document).
- Bond investors are positioned for a slowing economy and falling inflation—expecting these to lead to lower rates from the Fed over the intermediate time horizon.
- Treasury rates have been very patiently signaling that inflation is going to eventually abate and the Fed will pivot into an easing campaign some time mid-to-late next year.
U.S. market performance: Equity and fixed income
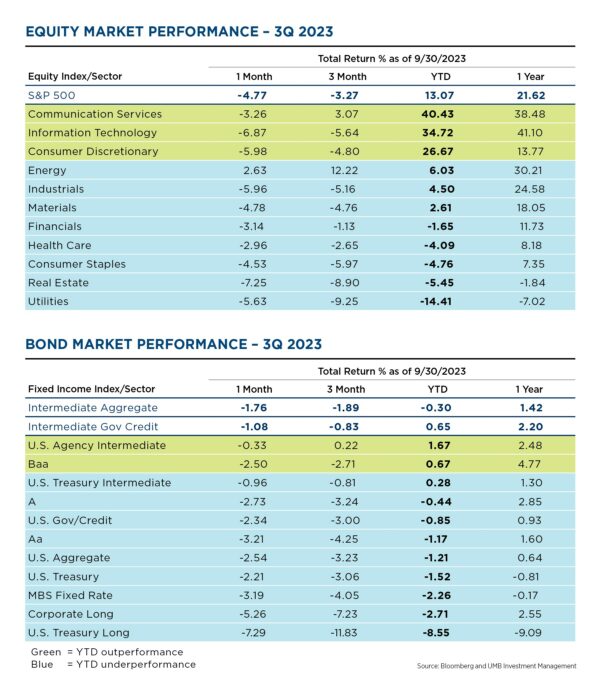
• U.S. equities ended the quarter lower, with stocks selling off in August and September.
• Despite the economic and earnings momentum, the selloff was driven by fears over higher interest rates.
• The energy sector was the strongest performer. Earnings expectations for energy companies moved higher over the rally in oil prices. Strong demand for oil due to a strengthening economy and reduced oil supply is driving the rally in oil prices.
• The utilities and real estate sector were the weakest performers. Valuations for these sectors are being lowered due to higher interest rates. With the rise in interest rates, Income stocks are competing with cash and fixed income, for the first time in a long time.
• Rates have been grinding higher in tandem with the Fed’s strong message. This has pushed fixed income returns into negative territory.
• Performance has been challenging across most sectors of the market. Rising rates have pushed most portions of the bond market into the red.
• The U.S. 10-year treasury note hit a 15-year high, closing the quarter at 4.55%. Rates appear to be nearing a cyclical peak.
• If rates are somewhere near their peak, which we believe to be the case, then returns could be quite handsome over coming quarters.
Follow UMB‡ on LinkedIn to stay informed of the latest economic trends.
When you click links marked with the “‡” symbol, you will leave UMB’s website and go to websites that are not controlled by or affiliated with UMB. We have provided these links for your convenience. However, we do not endorse or guarantee any products or services you may view on other sites. Other websites may not follow the same privacy policies and security procedures that UMB does, so please review their policies and procedures carefully.
DISCLOSURES AND IMPORTANT CONSIDERATIONS
UMB Investment Management is a division within UMB Bank, n.a. that manages active portfolios for employee benefit plans, endowments and foundations, fiduciary accounts and individuals. UMB Financial Services, Inc.* is a wholly owned subsidiary of UMB Financial Corporation and an affiliate of UMB Bank, n.a. UMB Bank, n.a., is a subsidiary of UMB Financial Corporation.
This report is provided for informational purposes only and contains no investment advice or recommendations to buy or sell any specific securities. Statements in this report are based on the opinions of UMB Investment Management and the information available at the time this report was published.
All opinions represent UMB Investment Management’s judgments as of the date of this report and are subject to change at any time without notice. You should not use this report as a substitute for your own judgment, and you should consult professional advisors before making any tax, legal, financial planning or investment decisions. This report contains no investment recommendations, and you should not interpret the statements in this report as investment, tax, legal, or financial planning advice. UMB Investment Management obtained information used in this report from third-party sources it believes to be reliable, but this information is not necessarily comprehensive and UMB Investment Management does not guarantee that it is accurate.
All investments involve risk, including the possible loss of principal. Past performance is no guarantee of future results. Neither UMB Investment Management nor its affiliates, directors, officers, employees or agents accepts any liability for any loss or damage arising out of your use of all or any part of this report.
“UMB” – Reg. U.S. Pat. & Tm. Off. Copyright © 2023. UMB Financial Corporation. All Rights Reserved.
*Securities offered through UMB Financial Services, Inc. Member FINRA, SIPC, or the UMB Bank, n.a. Capital Markets Division
Insurance products offered through UMB Insurance Inc.
You may not have an account with all of these entities.
Contact your UMB representative if you have any questions.
SECURITIES AND INSURANCE PRODUCTS ARE: NOT FDIC INSURED | NO BANK GUARANTEE | NOT A DEPOSIT | NOT INSURED BY ANY GOVERNMENT AGENCY | MAY LOSE VALUE
