We had an amazing ride during the third quarter of 2024. The headlines (both economic and otherwise) were volatile, and the markets were as well. We’re heading into the holiday season having experienced an amazing run in the broad equity markets. The economy and the U.S. consumer appear to be on more stable footing than we believed just a few weeks ago, but there are still concerning signals coming from the labor market.
Politics
In July, we had an assassination attempt against the Republican candidate for president. The election then seemed an absolute certainty in favor of former President Trump, but within just a few days President Biden was replaced on the ballots by Vice President Harris– and within a few weeks the election forecasts had moved much closer to 50/50 odds. Regarding the election, we moved from uncertainty to certainty and back to uncertainty in a matter of a few weeks.
Markets
Later in July (spilling into August), the financial markets were rocked with concerns over the “Yen Carry Trade” — putting pressure on the Japanese markets, as well as currency exchange rates. The S&P plunged 8.5% on fears of global “contagion.” Markets then stabilized and pushed steadily higher throughout August, only to run into another pothole in early September. Several softer-than-expected economic releases created fears of a deceleration in economic activity, and the S&P dropped nearly 10% from its recent peak. Fortunately, the FOMC displayed firm commitment to keeping the economy afloat when they delivered a 50-basis point rate cut (to 5.00%) in mid-September, giving the markets a firm boost. By quarter end, we had established new all-time highs, and were sitting on 20%+ YTD gains from the S&P.
Economy
In recent weeks, the Bureau of Economic Analysis (BEA) released a major revision to GDP data, reaching back 5 years. The revised “hard” data revealed that overall economic activity was stronger than we had thought coming out of the Covid recession. Also in the release, Gross Domestic Income (GDI) was higher than expected, and the household savings rate was bumped dramatically higher. In aggregate, we learned that the US economy and the average Consumer were on stronger footing than previously understood. Shortly after those revisions, we got surprisingly strong data from the labor market (payrolls and Unemployment).
These positive surprises — combined with the certainty of lower rates headed our way — helped push many forecasters towards higher odds of achieving a soft landing in the U.S. (Inflation comes down to target, without a meaningful slowdown in the economy). The validity of the recent data is being questioned by some experts, and we certainly need more confirmation of those numbers in upcoming releases – but the overall tone turned decidedly more optimistic in recent weeks.
Uncertainty
We are now faced with an uncomfortable situation where the government’s “hard data” sits in nearly direct conflict with a large batch of “soft” (survey based) data, regarding the labor market. Payrolls and Unemployment are currently painting a fairly rosy picture about the jobs market – which would support robust consumption going into next year. However, many of the leading indicators for the jobs market (the Quits Rate, the Hires Rate, Sentiment reports on “Jobs are not plentiful”) are showing readings that have previously only been associated with meaningfully economic slowdowns. The labor market is the key driver of consumption, and therefore the most critical variable for our economy headed into next year.
Household consumption in the U.S. has been amazing since the Covid recession and has driven an incredible economic and market expansion over the last 2 years. Consumption will follow the patterns of the Labor market, and the data from the labor market is sending conflicting signals – uncertainty around this key economic variable is quite high.
Consumption
Over the last 2 years, consumption (and therefore GDP) has been driven by excess savings, robust income growth, and a steady buildup of debt. All three of those variables appear to be rapidly fading as we head into 2025.
- Excess savings: Covid stimulus resulted in a huge buildup of excess savings for the average U.S. household, estimated to have peaked at roughly $2-3Trillion in 2021. It now appears that virtually all the excess savings has been spent down, likely eliminating one of the most powerful tailwinds for consumption.
- Income growth: Labor market leading indicators point towards a rising unemployment rate over coming quarters. Wage growth has been decelerating for quite a long time in the U.S., and a weakening labor market should only exacerbate this deceleration as we move through 2025.
- Debt: Consumer debt has been growing, and delinquency rates on credit cards have risen dramatically over the last year – reaching levels that would normally be associated with recessionary cycles. This would typically mean that debt will no longer be a driver of consumption.
Election
The pending election is certain to arouse strong emotions in the population, and the results could be postponed/contested for weeks after the polls close – exacerbating the uncertainty and angst. The good news is that election results tend to not have meaningful impacts on the economy or markets over subsequent years. There are numerous reasons that elections are important — but there is no data supporting the notion that election results should impact our investment strategies. An age-old maxim is as true today as it has ever been: Politics should be expressed at the polls, not in portfolios.
Looking forward
Once the election is past, we foresee an upcoming cycle with weakening in the labor market and a decelerating economy. While not likely to result in a recession, we do expect the U.S. to experience a period of below average growth – with GDP in the 1 –1.5% range, before the Fed easing cycle finally kicks in and pushes the economy back up towards our long-term average growth rate of roughly 2.0%. At this point, it appears that the risk is to the upside. A true soft landing, with GDP staying healthy around 2.0%, is becoming an increasing probability — but still well less than 50% at this time. Given the heightened uncertainty that continues to dominate our environment, elevated volatility is to be expected throughout 2025.
Economic forecasts for the remainder of 2024
Fixed income outlook
Interest rates spent the third quarter grinding lower, in anticipation of the initiation of an easing campaign from the FOMC. As we moved closer to the September Fed meeting, it became increasingly clear that the Fed was likely to make their first cut — and rates dropped in anticipation of what is presumed to be a prolonged series of cuts over the next 24 months.
Inflation data continued to grind lower, along a path towards the Fed target range of 2 – 2.5%. The various measures of inflation are all still above target, but all are moving steadily lower. This is providing plenty of room for the Fed to cut rates. As inflation has fallen, real rates (minus inflation) have actually been increasing – making Fed policy steadily more restrictive. The Fed needs to start moving rates lower in order to not send the economy into a recessionary downturn.
After dropping more than 1.25% during the quarter, rates adjusted back upwards in response to the surprisingly strong jobs data that appeared in early October. The slope between the 2 and 10-year Treasury notes has now moved from a long period of inversion (signaling recession risk) to nearly flat – indicating a “normalization” of expectations for the economy, inflation and rates.
High-yield spreads have moved in tandem with the amazing runup of the stock market — with average spreads very close to all-time lows. The high-yield market joins the stock market in signaling an expectation of a soft landing, leading to another expansion cycle for the U.S.. valuations are “stretched” — and we are cautious that this space may be “priced to perfection”. We are hopeful that the high-yield market is sending the correct signal, and we’d welcome another long period of expansion — but we are cautious, given the robust valuations reflected in current yield levels.
We foresee the Fed cutting rates steadily throughout 2025, eventually bringing Fed Funds to 3.50%. Longer-term rates appear to already be properly positioned for this outcome, and therefore may not come down in tandem with the Fed moves.
Equity outlook
Markets continued to build on a strong start to the year, even in the face of political turmoil and rising economic uncertainty. The Fed finally initiating their much anticipated first cut and solid corporate earnings helped to offset anxieties, and the S&P 500 hit another new all-time high and finished the quarter with strong gains.
While the first half of the year was characterized by narrow market leadership (once again driven by the “Magnificent 7”) and a hawkish repricing of Fed rate-cut expectations, third quarter saw solid performance from a much wider range of stocks and increasing expectations for more rate cuts in 2024. Behind this shift was increased expectations for an economic soft landing and a more dovish pivot from the Fed that has the market now looking for 100 basis points in total Fed cuts by year-end.
Given the recent rotation in market leadership, we often get the question, “If the Mag 7 names are no longer the best performers, who are the new leaders?” The answer comes from an unlikely place…utilities and REITs. These traditional bond proxy sectors are not typically thought of as market leaders, at least not when equities continue to show the level of strength that they recently have, but rates moving lower helped out these higher yielding sectors. And in the case of utilities, they experienced a dual tailwind of not just rates moving lower, but the sector was also helped by demand for electricity growing, powered in part by the AI boom and its dependence on power-hungry data centers.
What also helped support the rotation from the Mag 7 to the other 493 names in the S&P 500 was relatively strong corporate earnings. S&P 500 companies saw 11.3% y/y earnings growth for the second quarter, the highest level since the fourth quarter of 2021. Some 80% of these firms beat earnings estimates (better than the 77% five-year average) while only 67 S&P firms offered negative guidance (lowest number since Q4’22). Looking ahead, analysts are expecting S&P third quarter earnings to remain positive but step down to a 4.3% yoy pace.
Heading into next year, while earnings look to remain strong all eyes will be on the Fed to see if they continue to ease, with a lot of attention on the pace of rate cuts. The good news is that positive expected earnings growth, cooling inflation, and easing central banks create a robust backdrop for risk-based assets. That said, geopolitical risks and election uncertainty will be at the forefront for the rest of the year, suggesting investors should be prepared for a bumpy ride.
Economic growth and soft landing hopes
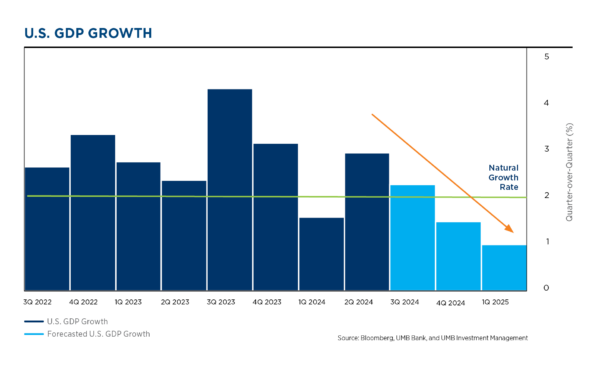
- The U.S. economy has been running at an above-normal pace for quite some time.
- Strong household consumption patterns have pushed very strong GDP growth rates over the last year, but we expect that to taper off.
- Consumption has been driven by excess savings and a VERY strong labor market.
- The outlook for both saving and the labor market appear to be slowing (see following pages).
- This all means it is likely that GDP growth will be slowing as we navigate through 2024, with a reasonable probability of below-normal growth as we close out the year.
Excess savings and the savings rate – Consumption boost may be tapering off
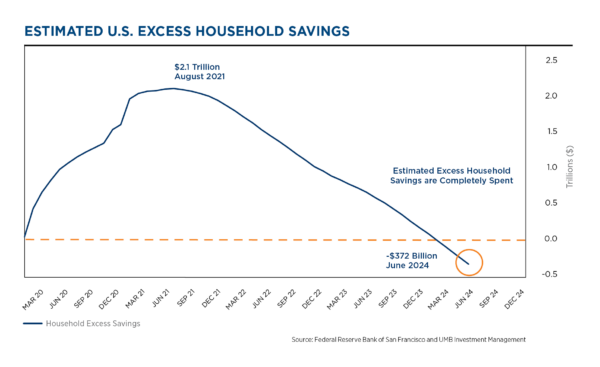
- One of the primary drivers of the surprising strength of Consumption in 2023 was the final drawdown of the excess savings that were accumulated during and after the Covid crisis.
- While there are differences of opinion around the precise numbers, there is broad agreement that several trillion dollars of excess savings built up during and after the Covid recession.
- This massive wall of excess savings helped bolster consumption throughout 2023, particularly for middle and lower-income households. However, according to the Federal Reserve of San Francisco, this massive mountain of savings was depleted earlier this year.
- This will remove a very strong tailwind for consumption, increasing the probability of an economic deceleration later in 2024.
Market indicators hinting at slowdown in wages (and economy)
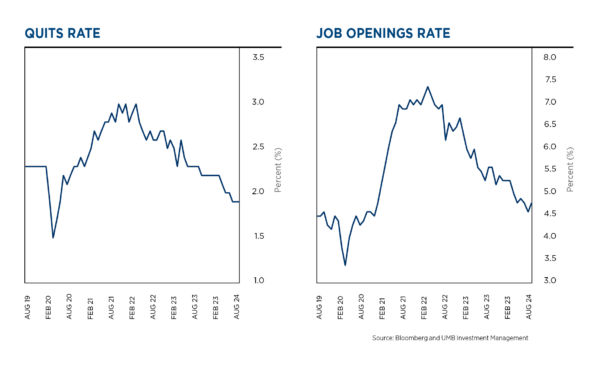
- Leading indicators from the labor market continue to point to a slow-down later in the year.
- Multiple data points from the labor market have been steadily falling for several months, indicating softness in the system.
- The quits rate (those voluntarily separating from jobs) has fallen to a level well below where it was before the pandemic.
- The job openings rate has traced a similar path and is nearly to its pre-pandemic readings.
- These, and numerous other leading indicators are signaling that the labor market will be softening, with unemployment rising, as the year progresses.
- Softening labor markets traditionally lead to lower wage growth.
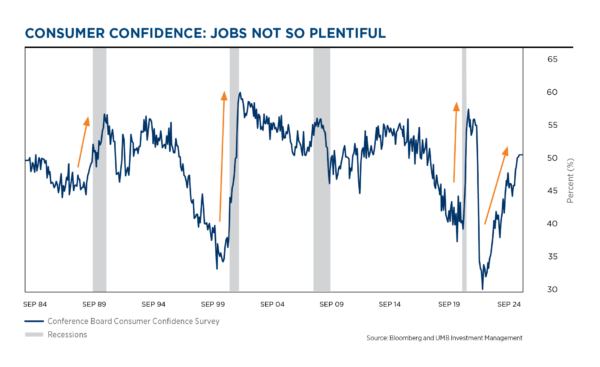
- Consumers are increasingly reporting that they do not feel that jobs are easy to find.
- “Jobs Not Plentiful” is yet another labor market indicator that has moved in a pattern that has previously only been associated with recessions.
- Numerous “soft data” points (based on surveys) such as these are sending signals that have, in all previous cycles, only occurred when the U.S. is entering a recession.
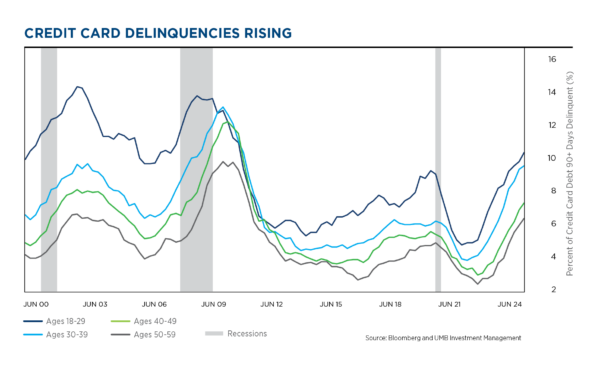
- Credit card data are showing signs of a weakening economy.
- Credit card balances have been growing, and delinquencies are on the rise.
- Delinquency rates shown on the left are all at levels higher than what was reached during the Covid recession.
- Delinquency rates have reached levels higher than where we entered the recessions of 2001 and 2008.
Equity markets
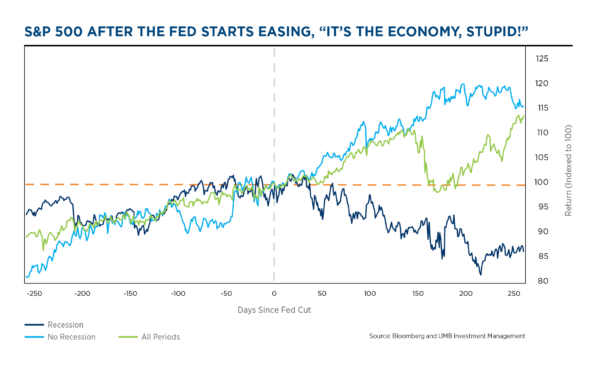
- On the surface, the Fed starting to cut rates has historically been a boost to equities.
- The green line on the left shows the median return of the S&P 500 surrounding the onset of a Fed cutting cycle. However, that green line doesn’t tell the whole story.
- In reality, how stocks and bonds perform after the Fed kicks off its rate-cutting cycle seems to depend on one factor more than most: the health of the U.S. economy.
- The start of the last three easing cycles (’01, ’07, ’19) were all quickly met with recessions and stocks headed lower, however the ’80s and ’90s saw multiple cutting cycles where the economy and stocks held up well.
- It’s still too early to tell if the Fed will pull off a smooth cutting campaign, but if they do it’s likely we’ll see markets continue to grind higher alongside.
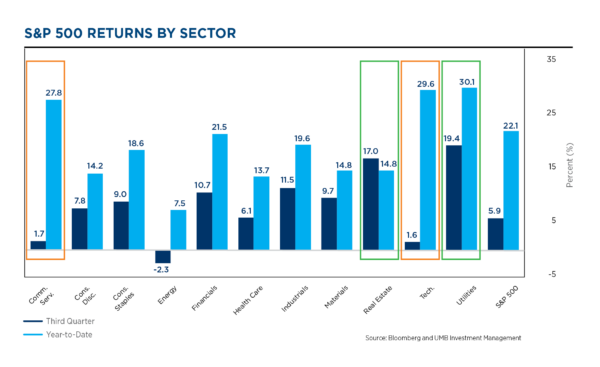
- So far in 2024, the stock market has been a tale of two halves.
- On the left above, you can see the year-to-date performance story (light blue bars), which looks dramatically different than the third quarter story (dark blue bars).
- The first half of the year was again dominated by tech and the Mag 7. Like much of 2023, there’s been one big driver behind those eye-popping gains: artificial intelligence.
- The third quarter saw the market rotate away from Mag 7 names within tech and communications and move into more rate-sensitive sectors like utilities and real estate as rates headed lower in anticipation of the start of the Fed cutting cycle.
Fixed income markets
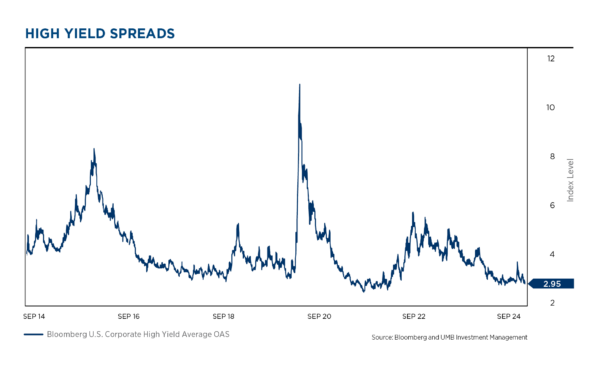
- Credit markets are riding the coat tails of the very strong equity markets.
- Credit spreads are near the lowest ranges of the last several cycles.
- This valuation implies a nearly perfect outcome for the economy and credit markets and leaves little (or no) room for any upside surprises in default rates.
- Credit markets appear to be positioned for a perfect soft landing, with no below-trend cycle for the U.S. economy.
- We are cautious on valuations in this space, given that we do not foresee a soft landing as the most likely outcome for the U.S.
Elections: The economy and markets
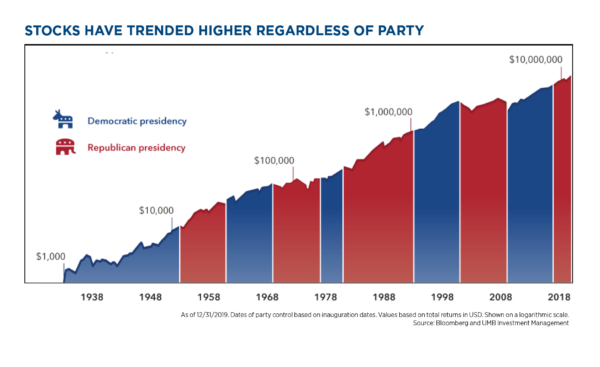
- Historical data show us that election outcomes do not have clearly identifiable impacts on the markets.
- The chart to the left is one of many charts on this topic, and it is virtually impossible to find clear correlation between election outcomes and market outcomes.
- Yes…. red waves tend to be correlated with lower taxes and regulation, and blue waves typically bring higher amounts of both. But the economy and markets have marched steadily higher despite either of those situations for many decades and we do not foresee that trend changing based on this single upcoming election.
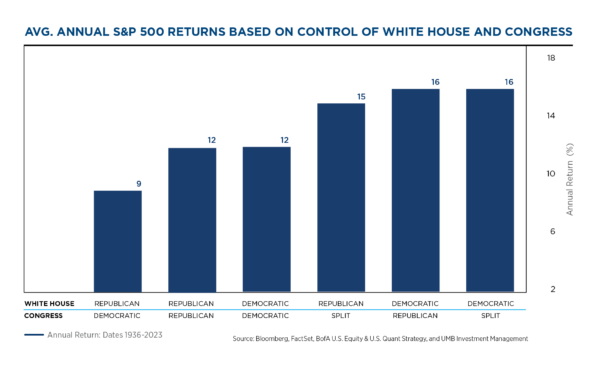
- Stocks have a long history of performing better under a divided government. That’s because divided government makes it harder to enact new legislation, so the status quo stands.
- This provides investors with a higher sense of certainty of what lies ahead, which the market covets.
- At the end of the day, the market doesn’t like uncertainty, with gridlock, the market reduces some of that uncertainty.
Follow UMB‡ on LinkedIn to stay informed of the latest economic trends.
When you click links marked with the “‡” symbol, you will leave UMB’s website and go to websites that are not controlled by or affiliated with UMB. We have provided these links for your convenience. However, we do not endorse or guarantee any products or services you may view on other sites. Other websites may not follow the same privacy policies and security procedures that UMB does, so please review their policies and procedures carefully.
Disclosure and Important Considerations
UMB Investment Management is a division within UMB Bank, n.a. (a subsidiary of UMB Financial Corporation) that manages active portfolios for employee benefit plans, endowments and foundations, fiduciary accounts and individuals. UMB Financial Services, Inc. is also a subsidiary of UMB Financial Corporation and is an affiliate of UMB Bank.
This report is provided for informational purposes only and contains no investment advice or recommendations to buy or sell any specific securities. Statements and projections in this report are based on the opinions and judgments of UMB Investment Management and the information available as of the date this report was published and are subject to change at any time without notice. UMB Investment Management obtained information used in this report from third-party sources it believes to be reliable, but this information is not necessarily comprehensive, and UMB Investment Management does not guarantee that it is accurate. All investments involve risk, including the uncertainty of dividends, rates of return and yield and the possible loss of principal. Past performance is no guarantee of future results.
You should not use this report as a substitute for your own judgment, and you should consult with professional advisors before making any tax, legal, financial planning or investment decisions. This report contains no investment recommendations, and you should not interpret the statements in this report as investment, tax, legal, or financial planning advice.
Neither UMB Investment Management nor its affiliates, directors, officers, employees or agents accepts any liability for any loss or damage arising out of your use of all or any part of this report.
“UMB” – Reg. U.S. Pat. & Tm. Off. Copyright © 2024. UMB Financial Corporation. All Rights Reserved.
Securities are offered through UMB Financial Services, Inc. Member FINRA, SIPC, or the UMB Bank, n.a. Capital Markets Division.
Insurance products offered through UMB Insurance, Inc.
You may not have an account with all of these entities. Contact your UMB representative if you have any questions.


