The Federal Reserve continues to show strong resolve in fighting what is proving to be a stubborn inflation problem. They’ve been executing one of the most aggressive tightening campaigns in history, and continue to telegraph that more moves are coming. Additionally, they have been united in professing a need for rates to remain elevated well into 2024 before they pivot towards lower rates. The FOMC has slowed the pace of tightening, even choosing to skip a move at the June meeting. But their messaging is still quite “hawkish”, leaving investors, the financial markets, and indeed most of the world waiting to see how much impact the tightening campaign will have on inflation and the economy.
Waiting through the uncertainty will prove hard for investors, and we expect market volatility to be elevated until we get more clear confirmation that interest rates have peaked.
Inflation
Inflation continues to give the FOMC reason for concern. Headline CPI has been dropping dramatically over recent months, but the Core data (adjusting our Food and Energy) have been quite stubbornly stuck in the 4.5-5.5% range—well above the Fed’s 2.50% target. In just the last two weeks, core CPI made a surprise shift lower, giving many hope that we may finally see some progress towards broadly lower Core inflation, but we will have to wait and see if the trend continues to take hold. The job market is still incredibly tight and wage growth is robust.
However, the housing market is finally starting to show some signs of cooling off which should help soften overall inflation. Meanwhile, the Fed continues to signal their intention to keep rates elevated until core inflation has clearly begun to head lower…we are all waiting for signs of relief.
Interest rates
We believe the Fed is very near the end of its hiking cycle. They chose to skip hiking at the June meeting, slowing their pace and signaling an intention to wait and search for signs of slowing in the economy. We’ve spoken of the substantial “lag effect” that delays how/when interest rate movements impact economic activity—we are only now fully understanding the impact of the rate movements that have been enacted over the last 15 months.
We still expect one or two more upward moves from the Fed, but we believe that inflation will continue to soften later in the year. This should allow the Fed to ‘pivot” and begin lowering interest rates in 2024. Longer-term rates are already reflecting this outlook, with the entire Treasury curve well below overnight rates (inverted). Bond investors are positioned for lower inflation and a softer Fed in 2024.
Soft landing, hard landing, or no landing?
The economy is slowing down, and is most likely headed for a mild, short recession. Our primary recession indicators (Leading Economic Index, Yield Curve, and Consumer Confidence) are all flashing red, signaling a high probability of recession in the next 9 months. Higher interest rates and tightening lending standards are beginning to bite. There is a high probability that later this year the slowdown will be strong enough to be labeled a recession, but will likely be referred to as a new type of “soft landing”.
Outlook
A slowdown and mild recession is highly anticipated and fully priced into the financial markets. We believe the Fed will hike 2 more times before taking a long pause to watch what happens to the inflation data. Our base case forecast calls for the economy and inflation to cool off, probably resulting in a short, mild recession late in 2023 or early 2024. This will cause the Fed to pivot into easing mode in 2024. This will be the proper time to re-initiate heavier exposures to risk-based assets, such as equities.
Risks
We’ve been quite open about the primary risk to our forecasts, which is the possibility that Core inflation moves slightly lower but gets stuck in a range well above Fed target (stuck at 3.5% or higher). This would force the Fed to engage in another round of tightening and would push rates higher than either the economy or markets are expecting—leading to a more severe recession. Recent inflation news is encouraging, but there is still a meaningful risk that it gets mired at higher levels. There is also a modest risk that higher interest rates have already done enough damage to throw the economy into a deeper recession than is anticipated. We believe that this is the lowest probability of the likely outcomes.
Bond Markets
The Fed Cycle is nearing an inflection point
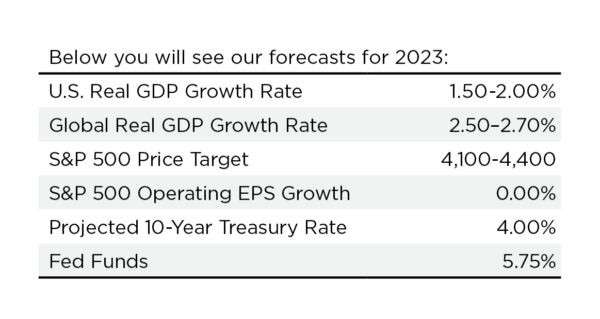
The FOMC made a much-anticipated skip at the June meeting, holding overnight rates at 5.25%. This was interpreted as another signal that they are nearing the end of their tightening campaign. Markets are fully anticipating another move in July, and show a 50% chance of one final move higher (to 5.75%) later in the year. Headline inflation has pushed sharply lower over recent months, but the Core (excluding Food and Energy) measures have proven stubborn. Both Core CPI and Core PCE are significantly above the Fed’s long-term target of 2.50%. Both have been trending sideways in the 4.50-5.50% range for quite some time. Core CPI made a surprise move lower recently, so there is hope that inflation may finally be trending in a more favorable direction. However, the Fed favors PCE as the most meaningful inflation data point, and it has not moved meaningfully lower at this time.
Chairman Powell has expressed a specific interest in “super core” inflation measures—and he points to PCE Core Services Less Housing as the key inflation metric that he and the committee follow. This very unique measure of Inflation has been quite stubborn—having been mired at 4.50% for nearly a year. It is hoped that underlying economic trends will help this measure start to push lower later in the year—allowing the Fed to pivot into easing mode early in 2024. In order for this to occur, we will need to experience some softening of the labor market (higher Unemployment) and easing of wage pressures. These are typically red flags for significant economic slowdowns, but we must keep in mind that the job market is simply too tight. We are in the uncomfortable situation where we need to hope for moderate signs of weakness in both Unemployment and wages—as these are the necessary conditions that will allow core services inflation to fall and the Fed to begin easing rates. Of course, we have to hope that the Fed moves swiftly to bring relief to the economy, in order to keep us from experiencing a more severe recessionary slowdown.
We believe that Inflation will stay strong enough to inspire the Fed to make two more moves higher in 2023. But we believe that Inflation will have already begun to move lower by year-end, in tandem with a slowly rising Unemployment rate. By early 2024, we expect Core Inflation measures to have moved down to 3.50% or lower, allowing the Fed to pivot into easing mode—taking overnight rates steadily lower throughout 2024.
The Treasury markets shifted aggressively towards this outlook several months ago. We believe that last October’s peak rate on the 10-year Treasury (4.25%) will likely mark the high-point for this cycle. We have begun to extend maturities on bonds and moved towards heavier fixed income allocations. Barring a severe recession (which we do not foresee at this time), we believe longer-term rates are already properly positioned for the most likely path for inflation and the Fed. Therefore, we don’t foresee interest rates on the long end moving meaningfully during the remainder of the year—with a high likelihood that the 10-year finishes the year very close to 4.00%, before moving lower throughout 2024.
High-yield markets
High Yield sectors have been benefitting from the strong “risk on” phase that has unfolded so far in 2023, posting strong positive returns, even with higher rates. Relative returns have been so strong that yield spreads in the HY space have become quite stretched—causing us to have some concern over High Yield valuations. We continue to believe there is a reasonable chance of a mild recession in 2023/24, and given that valuations appear stretched, we are cautious on the outlook for the next 6-9 months. We are currently neutral on High Yield allocations, and are looking for a reset of yield spreads and/or more clear signals that the Fed is preparing to pivot towards an easing cycle—once these events occur, we will increase allocations to risk assets, including High Yield.
Equity markets
Market recap
If there ever was proof of the adage about stocks climbing a ‘wall of worry’, it would be hard to find a better example than the first half of 2023. Just going off headlines, 2023 would seem like a tough year for stocks: we’ve had sticky inflation, a debt ceiling standoff, bank failures, geopolitical risks and aggressive central banks. Yet here we are, halfway through the year and S&P 500 is up nearly 17%. The big question is, why?
A big reason is strong performance from the “Magnificent Seven”, the seven companies responsible for almost three-quarters of the S&P 500’s first half returns. Shares of these companies, which include the biggest weightings in the index, soared between 40%-200% in the first six months of 2023, propelling the S&P 500 index to its highest level since April 2022. Even more impressive, the tech-heavy NASDAQ Composite Index gained almost 32% in the first half of the year.
Artificial intelligence
Optimism around AI has been a substantial boost to a stock market that faces numerous headwinds. A number of the Magnificent Seven stocks, like Nvidia and Microsoft, are at the center of the AI frenzy that has spread in the wake of chatbot sensation ChatGPT. As a result of the strong performance of AI related stocks, some are beginning to compare 2023 to the dot-com bubble of the late ‘90s-early 2000s.
At the index level, the current equity risk premium and earnings growth expectations are roughly in line with historical averages, suggesting investor optimism on AI adoption is not at extreme levels. However, at the individual stock level, the current valuations of some of the largest AI beneficiaries (like Nvidia) are similar to the 2000s valuation for some of the largest Dot Com Boom superstars (like Microsoft and Intel), though not as high as the most extreme examples (like Cisco).
While valuations have certainly expanded, there remain some big differences between the AI frenzy and the dot-com bubble. First, big tech was due for a small rebound after underperforming in 2022 (tech lost -28% last year vs -18% for the broader index). The other big difference is the outlook for most of these AI related companies is very strong, with the companies already producing a lot of positive cash flow. This is not like the dot-com bubble, where any company with a dot-com in their name experienced huge valuation jumps, regardless of negative cashflows or earnings.
Does the rally continue?
The stock market’s astounding rebound in the first half of the year was mostly driven by the Magnificent Seven. That “bad breadth,” as it’s known on Wall Street, has many investors waiting for the broad market to collapse if tech finally falters. However, even if the Magnificent Seven names run out of steam, it doesn’t necessarily mean bad news for the broader index. The other 493 names in the S&P 500 have mostly underperformed in the first half, which hints that at some point gains are likely to broaden out to these other names and help support the overall index.
It’s important to remember that stocks tend to be forward looking, not backward. All of the worry over a possible recession has distracted investors from the reality the S&P 500 already suffered through a bear market in 2022. A similar pattern often emerges during downturns; equity markets decline first, the economy worsens a few months later and enters a recession then equity markets bottom while the economy is still getting worse. While the second half of this year or early next year is likely to have challenging economic headlines, it could also be the start of a more durable bull market in equities.
Forecast
Even though the S&P 500 currently sits above our year-end price targets, for now we’re staying with our 7-14% 2023 return estimates, which equates to a price range of 4,100 to 4,400. We think the equity market could be range bound for the rest of the year, delivering flattish returns over the second half while likely experiencing elevated volatility.
We do acknowledge that if market strength broadens past the Magnificent Seven, it could support further gains. But as we highlight later in the presentation, typically it takes markets 3-6 months for concentrated gains to broaden out to the entire market.
Alternatives and privates
Real assets
Commodities have been mixed year to date as oil and the broad commodity complex have traded down due to global economic uncertainty, as well as questions surrounding geopolitical concerns in countries such as China and Russia. The cyclical element of commodities is showing as market reactions are closely following economic indicators as they are released.
In real estate, there is a dichotomy on multiple levels. By property type, industrial and multifamily continue to appear in favor with attractive trends in vacancy rates and rental growth. On the other side is office space, which is seeing increasing vacancy rates at the highest levels since 2013. Within office there is a disconnect between the best properties and those that can be deemed “middle of the road” in terms of quality and amenities. Employers seeking to bring talent back into the office are willing to pay premium rents for amenities and location while Class B properties are struggling with vacancy loss and rental growth. As employers continue to emphasize return to work and foot traffic increases, it would not be surprising if this trend continues. Regionally, some of the larger markets in the U.S. which saw population declines as a result of COVID are facing more pressure while the beneficiaries of those moves are less effected and even have tailwinds in some instances for rental growth and vacancies.
Alternatives
Any conversation around alternatives should come with a reminder that the asset class is very diverse, and the returns of underlying strategies have a much higher dispersion than other asset classes.
While 2022 was a proof point for including alternatives in a portfolio for its diversification benefits, the start of 2023 has produced more mild results to start as the broad asset class has underperformed both equity and fixed income market indices. Despite that, the current environment has the potential to create an enhanced opportunity set for investment managers using alternative approaches and investment instruments. Part one is the return of a non-zero risk free rate which is often used as a base when determining premiums on things such as selling securities short, options pricing, and arbitrage valuations. Part two is the increased volatility in the market which may create opportunities for alternative managers to act on.
While that is true for traditional managers as well, alternative managers have additional methods to express their opinion and are generally more willing to act on dislocations in a meaningful way to add alpha.
Private markets
The strong outperformance of private markets in recent periods has led many investors to be at or over their target allocations to the space. This combined with uncertain economic conditions has led to a slowdown in fundraising for new private investment vehicles compared to prior years. Some of the downstream impacts have included investment managers delaying or extending their fundraising windows and new firms entering the space may experience some challenges raising assets. As communicated last quarter, while our long-term outlook on private assets is positive, we anticipate near term valuation write-downs to reflect market uncertainty and increased financing costs, both of which we have seen cited by investment managers. Worth noting the valuation issues that are likely to hit the space are centered in venture and tech, while middle market buyout (traditionally the core of PE allocations) are fine so long as we don’t see a protracted economic downturn. Additionally, the IPO market and interest rate conditions have slowed down exit activity for the time being, meaning some private funds are holding on to their investments until a more attractive opportunity to sell comes up.
Economic uncertainties can also play to the advantage of certain segments of private markets, namely private credit. As tighter credit standards are enacted broadly, private credit managers have the opportunity to continue gaining market share as they have been for the last decade. This pull back from certain providers of capital could further bolster the returns available to private credit.
*Private investments require investors to meet the accredited or qualified purchaser requirements.
Mid-year update
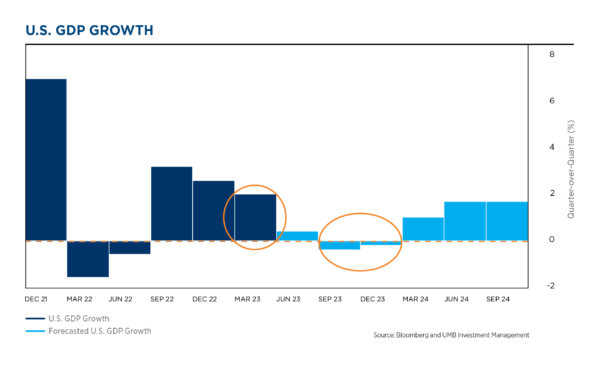
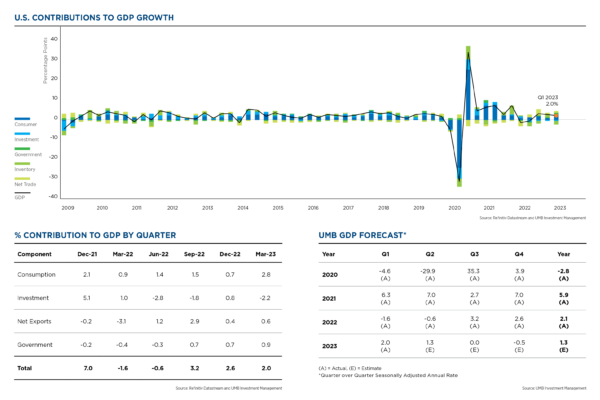
- While the U.S. economy showed stronger-than-expected growth in the first quarter of 2023, our annual forecast for a bumpy landing remains intact, calling for a mild contraction in economic activity in the second half of the year.
- While we do call for a slowdown, on the right side of the chart you can see how quickly things rebound as we move into 2024, highlighting the mild, short-lived slowdown or recession that is expected.
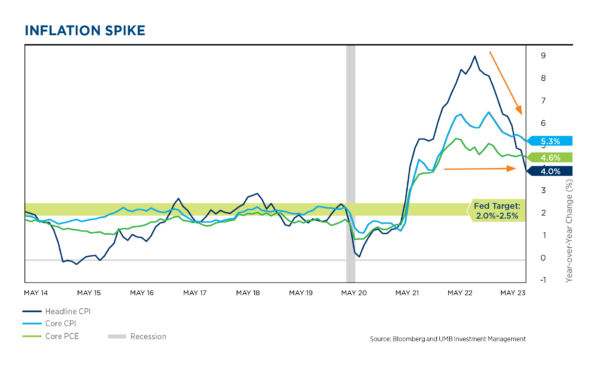
- Inflation remains a focal point for the Fed and the economy.
- The dark blue line shows headline CPI, the most common inflation number shown in the media. This number has been falling quickly, leading many investors to ask why the Fed continues to raise rates.
- The answer is in the green and light blue lines, PCE and Core PCE, the Fed’s preferred measures of inflation.
- While headline inflation has been falling, PCE and Core PCE remain stuck around 5%, well above the Fed’s target of 2.0%–2.5%.
- The Fed will remain tough as long as those numbers remain elevated. We must wait to see how high the Fed will hike rates and how much of an impact this will have on the economy.
Fed actions
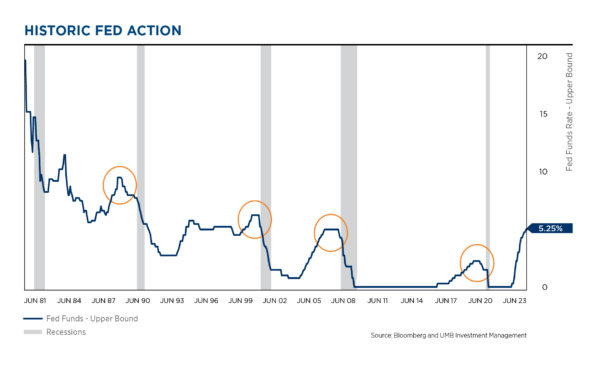
- The Fed typically gets blamed for causing recessions, and while all cycles have some similarities, they also have their own set of nuances.
- Typically, the Fed walks along with the economy, controlling inflation and controlling growth. Then, late in the economic cycle, inflation often is heating up and the Fed is hiking rates. The Fed usually will pause their tightening campaign, because interest rates work with a lag effect—they need time to see how quickly the economy will cool off.
- After this prolonged tightening period, and subsequent pause, the economy then typically falls into a recession.
- It could be different this time, but the steepness of the increase in the current tightening cycle is a big reason why most investors still think a recession is likely.
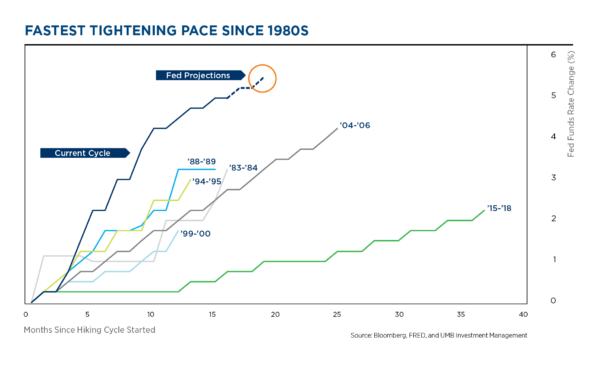
- This chart highlights the last six tightening cycles and is an easier way to see how rapidly the Fed is tightening rates.
- The time period from ’15–’18 is the only example where the Fed was not fighting an inflation problem. In the other five, the tightening cycles were all associated with an inflation issue.
- The dark blue line shows the current cycle—much quicker and much steeper than the Fed has moved before.
- Despite the steepness of this cycle, the Fed is still likely to hike again this month and telegraph they have more work to do, given how sticky core inflation continues to be.
Fed actions
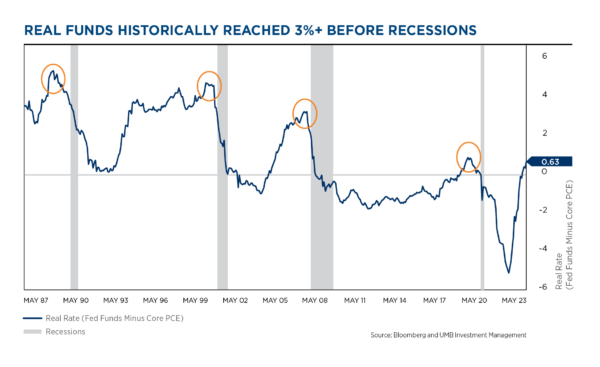
- The Fed prefers to track the movement of real rates…adjusting Fed Funds rates minus inflation.
- While the current Fed hiking cycle has already been quicker and steeper than in the past, this chart shows that, in real terms, the Fed has been less aggressive than previous cycles.
- In the previous three cycles (excluding the pandemic) the Fed took real rates up to 3%–5%…compared to today where they are just above 0%.
- This helps explain the speed and severity of the hikes. We also need to keep in mind the Fed is fighting a much more severe inflation spike than was present in previous cycles.
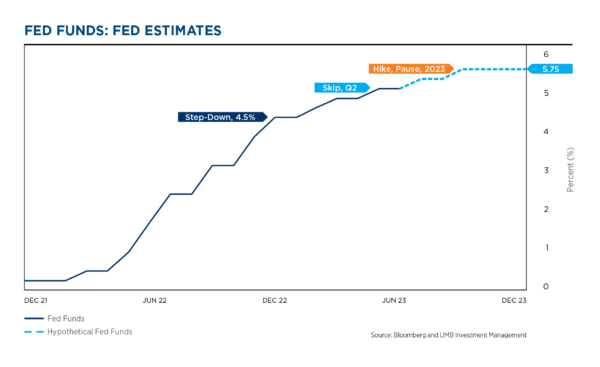
- We believe the Fed is very near the end of its hiking cycle.
- They chose to skip hiking at the June meeting, slowing their pace and signaling an intention to wait and search for signs of slowing in the economy.
- We still expect one or two more upward moves from the Fed, but we believe that inflation will continue to soften later in the year.
- Given our forecast of a slowing economy and inflation subsiding, we anticipate that the Fed will begin to lower interest rates in early 2024.
Inflation and money supply
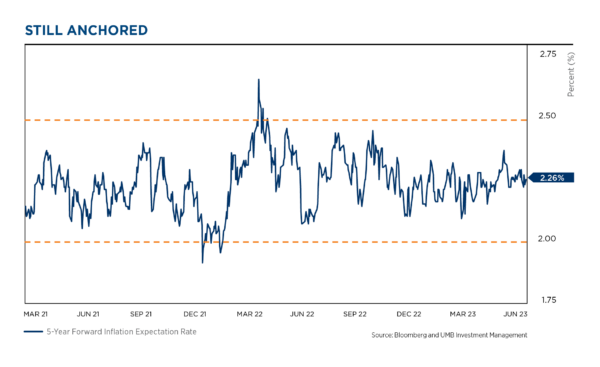
- The inflation expectation futures market has said all along that inflation will come back down to Fed targets. This matches the signals coming from the bond market.
- Shown here are 5-year forward inflation expectations, a data point the Fed follows, which indicates the outlook for inflation 5-years from now.
- While expectations spiked up a bit last year when we saw our first inflation scare, it has since settled down and is now holding steady in the middle of the long-term Fed target.
- The financial markets are indicating that the Fed will succeed in bringing inflation down to their target zone.
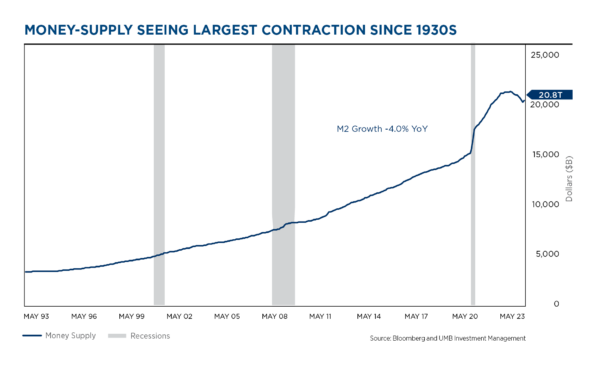
- M2 is a measure of cash and liquidity in the U.S. economy.
- During the pandemic we saw a spike in M2, which helped stimulate economic activity as well as financial markets. Now, with higher rates and banks tightening lending standards, we see money supply slowing.
- Last month we saw a contraction of -4.0%, one of the biggest contractions since the 30’s.
- While the drop-off in M2 is unprecedented, we did have room for this drop-off given the massive stimulus and increase in supply since the start of the pandemic.
- All of this aligns with our annual theme, Prepare for Landing, where this decrease in money supply will slow the economy and likely result in a mild, short-lived recession.
Economic fundamentals
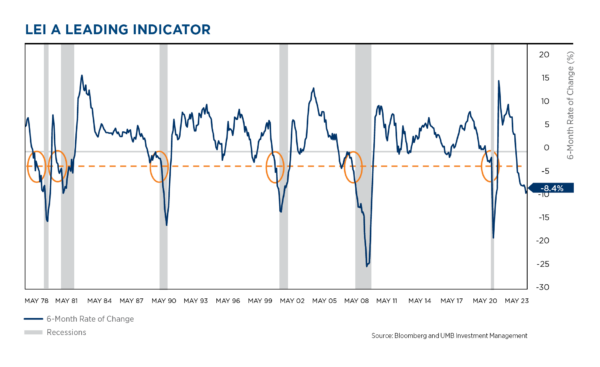
- The six-month rate of change in the Leading Economic Index (LEI) is one of our favorite recession indicators because of its almost perfect track record of forecasting looming recessions.
- Historically, when the six-month rate of change crosses -3.5%, a recession is imminent.
- The index currently stands at -8.4, which supports our theme of a bumpy landing.
- Given the index broke below the critical threshold last year, we would not be surprised if our economy has entered a mild recession around year-end.
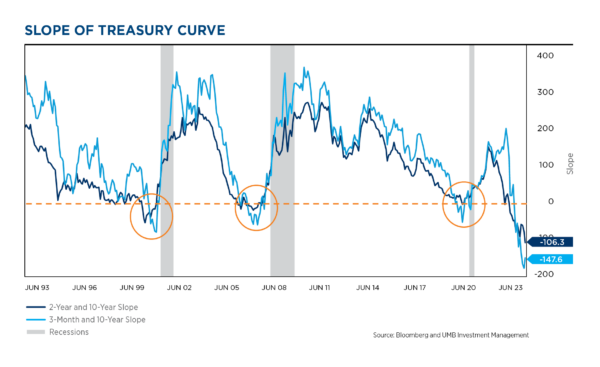
- Historically when we’ve seen inversions in the yield curve (orange circles), the Fed has stopped hiking. In this hiking cycle the Fed continued to hike interest rates long after the yield curve (Fed Funds to 10-yr. Treasury) became inverted.
- In this hiking cycle, the Fed was only in the early stages of tightening when the yield curve inverted, causing the inversion to become quite severe.
- The continued inversion of the yield curve is a good indicator that a recession is likely in the next 6-12 months. The bond markets are positioned for both inflation and rates to slow throughout 2024.
Economic fundamentals
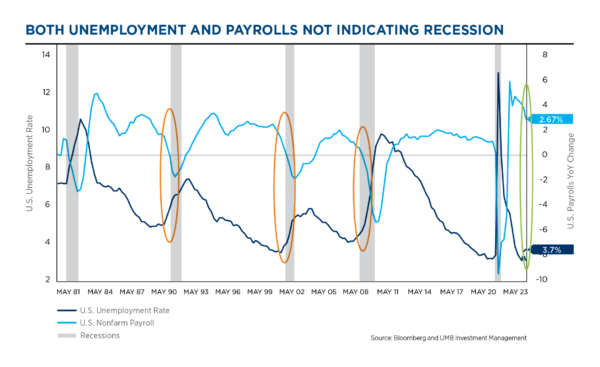
- We get a lot of questions of whether we are already in a recession. We think the labor market is key to this answer.
- Headline unemployment, shown in dark blue, typically starts to rise as we enter a recession. We have yet to see an increase in unemployment from historically low levels, even with numerous layoffs that have been announced.
- If people are gainfully employed, they typically don’t change their consumption behavior, supporting our theme of a slowdown, not a severe recession.
- We also examine non-farm payroll growth, shown in light blue, and find similar feedback. Payroll growth is typically falling into negative territory as we enter a recession. While we have seen payroll growth slowing, it has not turned negative and does not currently indicate we are in a recession.
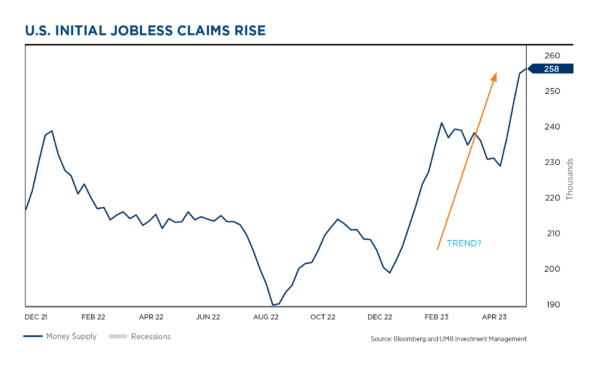
- Another number we follow closely is initial jobless claims.
- Initial claims are starting to move slightly higher, giving us clues that economic activity is slowing, but not a sign we’re heading into a recession just yet.
- Historically, we’ve seen initial jobless claims rise somewhere in the range of 300k–400k before we enter recession.
- The incredible strength of the labor market puts us on very strong footing going into this slowdown, which supports our expectation of a mild, short-lived recession.
Financial markets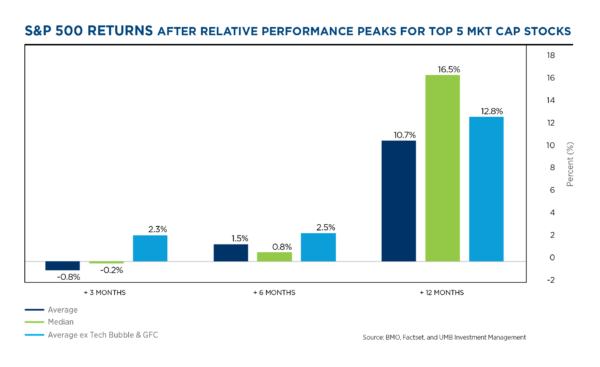
- A big reason for strong equity returns this year is strength from some of the biggest names.
- As a result, many investors have become concerned about the potential effects this top-heavy market could have on future returns, especially if momentum begins to fade.
- Fortunately, history shows that once relative performance of these mega-caps subsides, the broader market has historically held up just fine. That is what we show on the chart here, returns after other periods where the largest S&P stocks were outsized gainers.
- While data on the left side of the chart shows returns were down to flat in the first few months following previous peaks, returns then broadened out and the S&P 500 recorded average gains of nearly 11% one year later, shown by the dark blue bar on the right.
- So, while the run-up we’ve seen in mega cap names doesn’t typically spell disaster for the market. It does become a waiting game as we hope the rally in tech stocks broadens out.
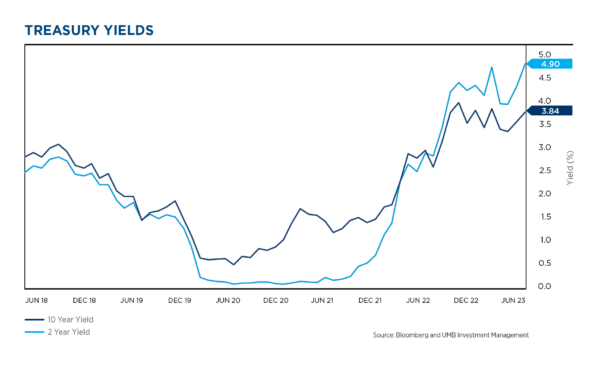
- The longer portions of the treasury market have risen over recent months, due to the strong messaging from the Fed.
- However, long term rates are all well below current overnight rates (the inverted yield curve we spoke about previously in this document).
- Bond investors are positioned for a slowing economy and falling inflation—expecting these to lead to lower rates from the Fed over the intermediate time horizon.
- Treasury rates have been very patiently signaling that inflation is going to abate and the Fed will pivot into an easing campaign next year.
U.S. market performance – Equity and fixed income
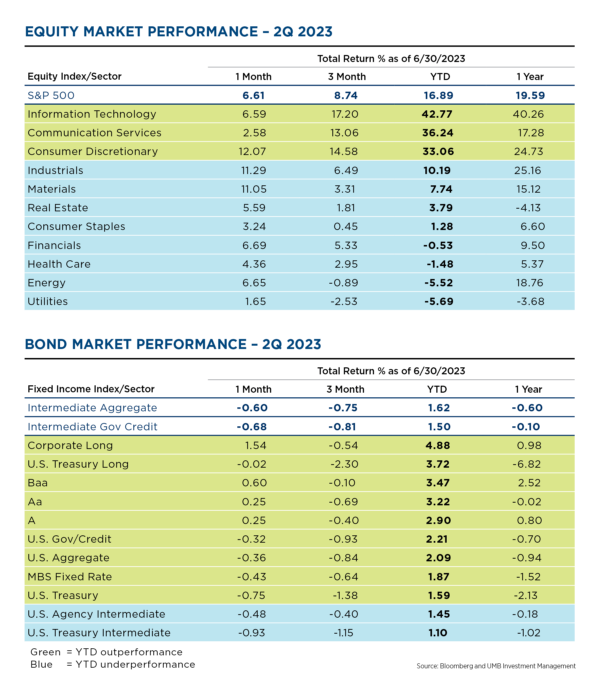
- U.S. equities ended the quarter higher, with the majority of gains coming in June.
- The advance came amid moderating inflation and signs that the U.S. economy remains resilient in spite of higher interest rates.
- There was some concern around the U.S. debt ceiling. However, Congress quickly approved legislation that suspended the debt ceiling in the first days of June, sending equities higher.
- The information technology sector led the stock market advance in the quarter. In particular, enthusiasm around AI and the potential for a boom in related technology drove chipmakers higher. The consumer discretionary and communication services sectors also performed strongly. Underperforming sectors included energy and utilities.
- Changing expectations for Fed policy sent rate-sensitive bonds slightly lower.
- On the credit front, U.S. investment grade posted negative total returns, but outperformed Treasuries over the quarter.
- The U.S. 10-year yield climbed back from 3.47% to 3.81%, with the two-year going from 4.03% to 4.87%, marking a further inversion of the curve.
Real Gross Domestic Product (GDP)
Follow UMB‡ on LinkedIn to stay informed of the latest economic trends.
When you click links marked with the “‡” symbol, you will leave UMB’s website and go to websites that are not controlled by or affiliated with UMB. We have provided these links for your convenience. However, we do not endorse or guarantee any products or services you may view on other sites. Other websites may not follow the same privacy policies and security procedures that UMB does, so please review their policies and procedures carefully.
DISCLOSURES AND IMPORTANT CONSIDERATIONS
UMB Investment Management is a division within UMB Bank, n.a. that manages active portfolios for employee benefit plans, endowments and foundations, fiduciary accounts and individuals. UMB Financial Services, Inc.* is a wholly owned subsidiary of UMB Financial Corporation and an affiliate of UMB Bank, n.a. UMB Bank, n.a., is a subsidiary of UMB Financial Corporation.
This report is provided for informational purposes only and contains no investment advice or recommendations to buy or sell any specific securities. Statements in this report are based on the opinions of UMB Investment Management and the information available at the time this report was published.
All opinions represent UMB Investment Management’s judgments as of the date of this report and are subject to change at any time without notice. You should not use this report as a substitute for your own judgment, and you should consult professional advisors before making any tax, legal, financial planning or investment decisions. This report contains no investment recommendations, and you should not interpret the statements in this report as investment, tax, legal, or financial planning advice. UMB Investment Management obtained information used in this report from third-party sources it believes to be reliable, but this information is not necessarily comprehensive and UMB Investment Management does not guarantee that it is accurate.
All investments involve risk, including the possible loss of principal. Past performance is no guarantee of future results. Neither UMB Investment Management nor its affiliates, directors, officers, employees or agents accepts any liability for any loss or damage arising out of your use of all or any part of this report.
“UMB” – Reg. U.S. Pat. & Tm. Off. Copyright © 2023. UMB Financial Corporation. All Rights Reserved.
*Securities offered through UMB Financial Services, Inc. Member FINRA, SIPC, or the UMB Bank, n.a. Capital Markets Division
Insurance products offered through UMB Insurance Inc.
You may not have an account with all of these entities.
Contact your UMB representative if you have any questions.
SECURITIES AND INSURANCE PRODUCTS ARE: NOT FDIC INSURED | NO BANK GUARANTEE | NOT A DEPOSIT | NOT INSURED BY ANY GOVERNMENT AGENCY | MAY LOSE VALUE


