3Q 2024 economic update and look ahead
Learn how the second quarter of the year surprised us a little and where we think the third quarter will take us.
The U.S. economy appears to have rebounded nicely in the second quarter of 2024, after a surprisingly tepid performance during the first quarter. The average U.S. household has been demonstrating consumption patterns that are well above normal, driving the economy back to above-trend growth in the second quarter. Not surprisingly, as consumption has been running hot, we’ve also been grappling with strong inflation data, with many key measures creeping higher in the early stages of 2024.
This unleashed a roller-coaster of consternation about the possibility that the Fed could be forced to stay on hold throughout most of the year and could even be forced to consider raising rates again if inflation continued to grind higher. Fortunately, the June inflation data finally broke the trend, coming in slightly lower than expected – which brought in a new round of optimism that the Fed could begin lowering interest rates later in the year. This helped re-ignite the powerful stock market rally that has been in place for most of the last 18 months. Through mid-year, the S&P 500 has posted an amazing 15% return.
The U.S. consumer has been the driving force behind our outstanding economic and market expansion of the last several quarters, with overall post-Covid consumption patterns running at a pace well above historical averages. Households have been emboldened by the massive wave of excess savings that built up during the Covid stimulus programs. As the Covid stimulus dollars were flowing, virtually the entire country also retained their jobs and incomes, enabling the U.S. to build up a multi-trillion-dollar mountain of excess household savings. Unsurprisingly, asset values have pushed steadily higher for the last two years, with both stock prices and home values marching higher almost without interruption. When viewed collectively, households have been emboldened by growing incomes, growing net worth and massive excess cash reserves — fueling higher-than-normal consumption patterns. This has been the key driver of overall economic activity, corporate earnings and equity returns over the last 18 months.
However, this has all occurred in the face of the most aggressive tightening of monetary conditions of the last 40 years. Consumption and inflation have remained quite strong, seemingly despite the best efforts from the Fed to curb activity. The FOMC has raised rates by more than 5.00% during their recent campaign, and we normally would have already experienced an economic deceleration by this point. Powerful household consumption has appeared to offset the impact of the Fed’s tightening campaign, but we believe that the impact of the Fed cycle was merely delayed – not eliminated. We must consider that above-trend consumption behavior can only be fueled by three sources: excess savings, growing income streams or a run-up in debt. We foresee challenges to all three of these areas as 2024 progresses.
Challenge 1: Excess savings
The first variable is the mountain of excess savings that was built up during Covid stimulus campaigns. The most thorough estimates placed the total excess household savings in the US at roughly $2-3Trillion when it peaked in 2021. It now appears that virtually all the excess savings has been spent down, likely eliminating one of the most powerful tail-winds for consumption. Additionally, the U.S. Household Savings rate (the amount of monthly income placed into savings) has dropped to one of the lowest levels in history. It must climb back to more typical levels over the coming quarters, which can only be accomplished if consumption is curtailed.
Challenge 2: Income growth
The second variable, income growth, is tied directly to the labor market, and we are continuing to see warning signs there. Numerous leading indicators from the labor statistics are continuing to send signals that the Fed tightening cycle may finally be starting to bite into the economy. The Quits Rate, The Job Openings Rate, Temporary Workers usage and numerous other variables have all been in strong downtrends in 2024, with several dropping well below 2019 levels. This sends a historically reliable signal that unemployment should be rising and also wage growth is likely to deteriorate as the year progresses – and both of those trends are clearly occurring at this time. As a softer labor market brings down wage growth, and the need for higher savings rates further dampens consumption – it seems that moderating of overall economic activity is all but a certainty. Credit card balances are elevated, and banks are already tightening lending standards, so it seems highly unlikely that households will be able to use debt to fuel another leg-up in consumption.
The good news is that lower consumption should help bring inflation much closer to the Fed’s target enabling the Fed to pivot into an easing campaign later in the year. If the Fed is able to move quickly towards lower rates, they may be able to prevent the slowdown from turning into an outright recession.
This will be a delicate and difficult balancing act — one that depends heavily on the pace with which inflation tapers off. The FOMC will be forced to determine whether inflation rates are “low enough” to rationalize lower interest rates. They’ve remained steadfast in their pledge to bring inflation sustainably back to 2.0%, but they will need to start easing interest rates before we reach that final destination. Our best estimate is that the coming slowdown in consumption will allow most measures of broad inflation to drop from above 3.0% to something in the 2.5 – 2.7% range as the year progresses. This should provide the Fed with enough evidence that inflation is moving “sustainably” towards their long-term target of 2.0%, thus allowing them to begin cutting interest rates as we approach the end of 2024. They obviously hope to prevent any economic slowdown from turning into outright recession. However, they cannot risk cutting rates too soon or too aggressively, or they may drive inflation back higher – so the task before them is exceptionally difficult.
We currently believe that the coming slowdown will not descend into a severe recession, but the potential range of outcomes is quite wide and the level of uncertainty around the many economic variables is high. The pending election cycle is certain to add additional volatility into the overall environment.
Fixed income outlook
Interest rates rode a wave of mixed messages regarding inflation throughout the second quarter. Early in the quarter, inflation looked to be pushing back higher, taking interest rates with it. As we moved through June, the inflation data finally turned lower, allowing the markets to position for lower overnight rates later in the year. Consequently, after spiking nearly .50% in April, rates moved back down in June, ending the quarter nearly exactly where they started — the 10-year Treasury finishing at 4.39%.
The outlook for Inflation is tied directly to the labor market and consumption, both of which we foresee softening throughout the back half of the year. If this comes to pass, then inflation should drift lower over the next six months. If Inflation is able to move down to the 2.50% range (on average), then the FOMC should feel empowered to signal their intention to begin taking overnight rates lower in a slow, controlled fashion. We think that the move lower for both inflation and rates will proceed slowly over the next 12-18 months.
U.S. bond market outlook
The U.S. bond markets are currently positioned for two cuts to overnight rates before the end of 2024. We believe that this outlook is reasonable, and therefore U.S. interest rates are reasonably positioned for the upcoming environment. If the FOMC is able to begin cutting overnight rates late in the year, we estimate that longer-term rates will move lower in tandem — with the 10-year treasury most likely ending the year around 4.00%. As we move through 2025, we expect short-term rates to fall more than longer-term rates. We see longer-term rates moving only modestly lower as we move through 2025. Of course, this outlook presumes that the US does not encounter a meaningful recession over the next 18 months. If the economy slips into a “harder landing” then both short and long-term rates could move meaningfully lower. This is not our base-case outlook, but it is certainly a meaningful risk.
The Credit markets have been following the positive trends in the stock market. With rising equity prices, credit spreads have remained near the low end of historical ranges. High Yield Credit spreads are near the lowest levels of any recent cycle, indicating that most spread-related categories are fully valued, with little remaining upside. This further supports our cautious outlook and bolsters our desire to avoid over-exposure to the riskier corners of the market over the next three to six months.
Equity outlook
The S&P 500 finished the first half of the year with an impressive 15.3% return, notching 31 record high closes along the way despite hot inflation data derailing investors’ expectations for when and how many times the Fed would cut rates this year. The first half of 2024 was very similar to what we experienced in 2023. Strong performance driven mostly by the largest stocks (MSFT, NVDA, AAPL, GOOGL, AMZN, META), which contributed 62% of the index’s first half return. Nvidia also remained the leader of the pack, just like 2023, with shares of the chipmaker rising 149% and joining the exclusive $3 trillion market cap club, only shared with the prestigious company of Microsoft and Apple.
While the index’s first-half performance has been nothing short of extraordinary, investors are starting to forget returns of this caliber aren’t common. While the 15% gain for the S&P this year has been roughly in line with gains seen in the first six months of both 2022 and 2021, it blows the historical average gain of 4.7% since the 1950s out of the water. The good news is history shows us that fast opening halves of the year generally maintain their momentum through the second half. Over the past 100 years there have been 29 instances when the S&P 500 was up 10% or more at the halfway mark. By year-end, the average gain was 24%, vs an average of only 10.6% across all 100 years. An encouraging sign as we move into the second half of the year.
Apart from the strength of the market, the concentration of the market also continues to make headlines. Yes, a handful of the largest stocks continue to drive the majority of returns. But it’s important to note the equal-weighted S&P 500 index still returned a very strong 5.1% in the first half. Meaning even the equal weighted index has beaten the cap weighted average return of 4.7%. Strong evidence the market has been stronger than most headlines give it credit for, and if earnings growth can broaden out past the Mag 7 it should be supportive of second half market returns.
As we move into the back half of the year, we continue to keep a close eye on the concentration of the market. While concentration alone doesn’t make us overly concerned, it does add another layer of risk. We also continue to watch for any sharp slowdowns in the labor market, which could signal a weaker economy than most expect and increase recession odds. For now, given the stronger than expected markets in the first half of the year and dampened volatility (even with uncertainty growing over the coming presidential election) we’re happy to maintain our focus on diversified portfolios with a high-quality tilt. And if fundamentals continue to prove resilient, we will likely look to add further to risk on opportunistic pullbacks.
Understanding GDP growth
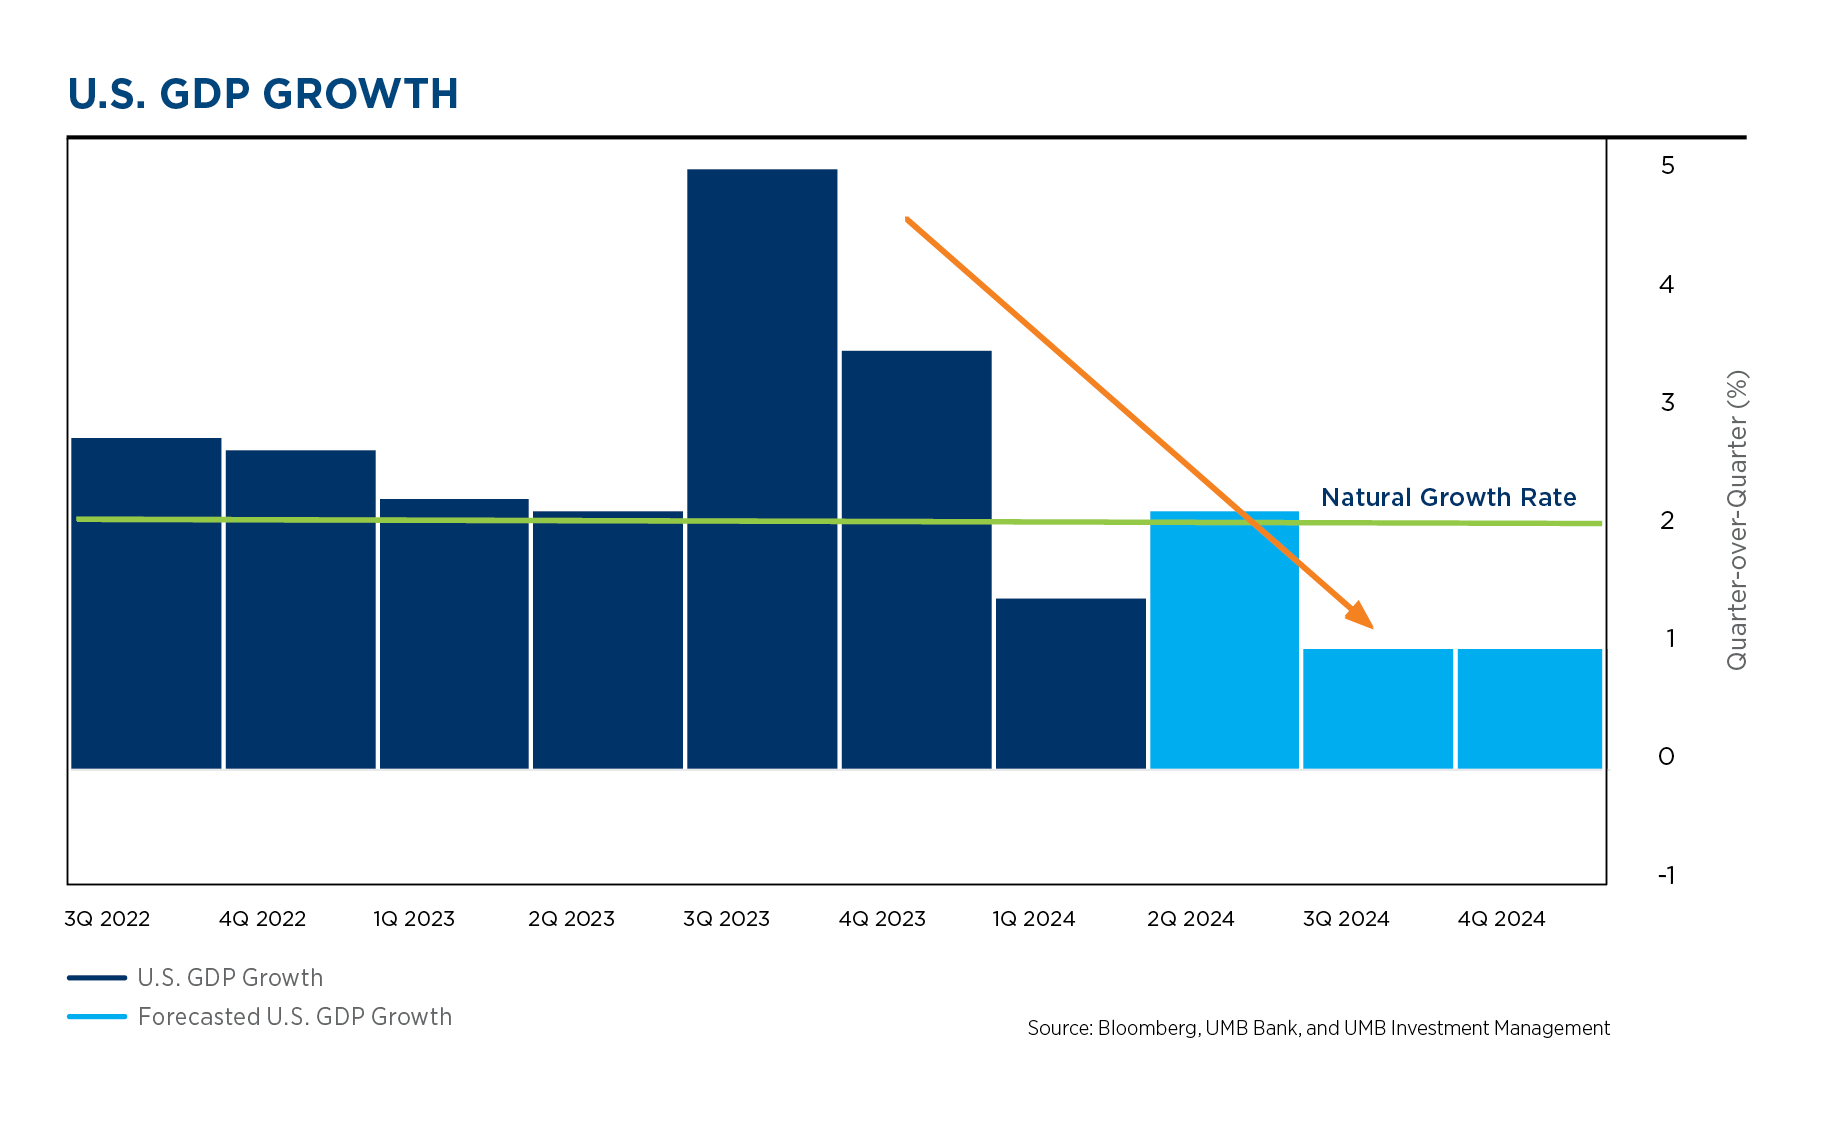
- The US economy has been running at an above-normal pace for quite some time.
- Strong household consumption patterns have pushed very strong GDP growth rates over the last year, but we expect that to taper off.
- Consumption has been driven by excess savings and a strong labor market.
- The outlook for both saving and the labor market appear to be slowing.
- This all means it is likely that GDP growth will be slowing throughout 2024, with a reasonable probability of below-normal growth for the last half of the year.
Inflation factors
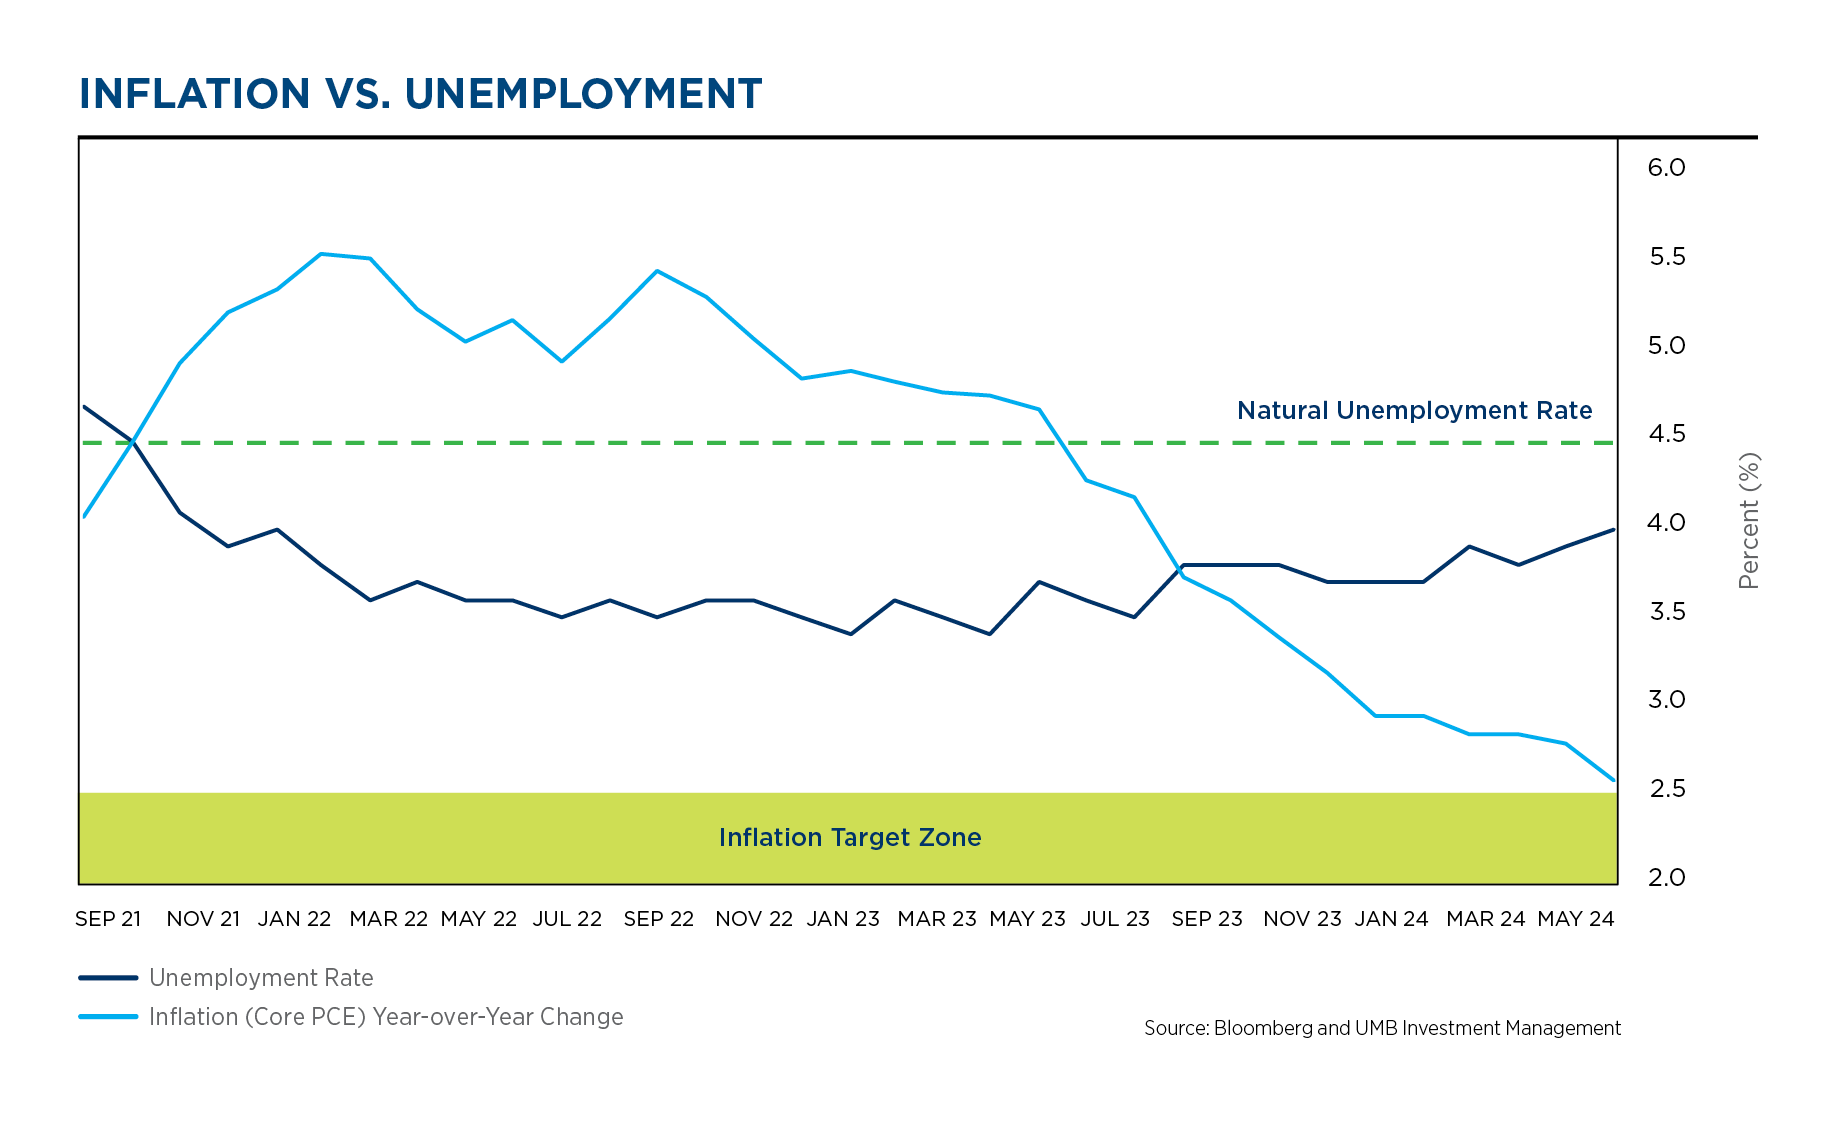
- Recent data paints a picture of a possible soft landing.
- Some measures of inflation have been steadily falling, with unemployment remaining relatively low (strong labor market).
- While some data appears to indicate a soft landing, we feel that many of the underlying leading indicators point to other more challenging outcomes.
- Inflation has continued to push slowly lower, while the early signals from the labor market are pointing towards a slowdown. The unemployment rate has pushed above 4%, triggering concerns of an ongoing deterioration in the jobs market. There are equal chances of both a hard landing (slowdown coming soon) and no landing (inflation stays too high).
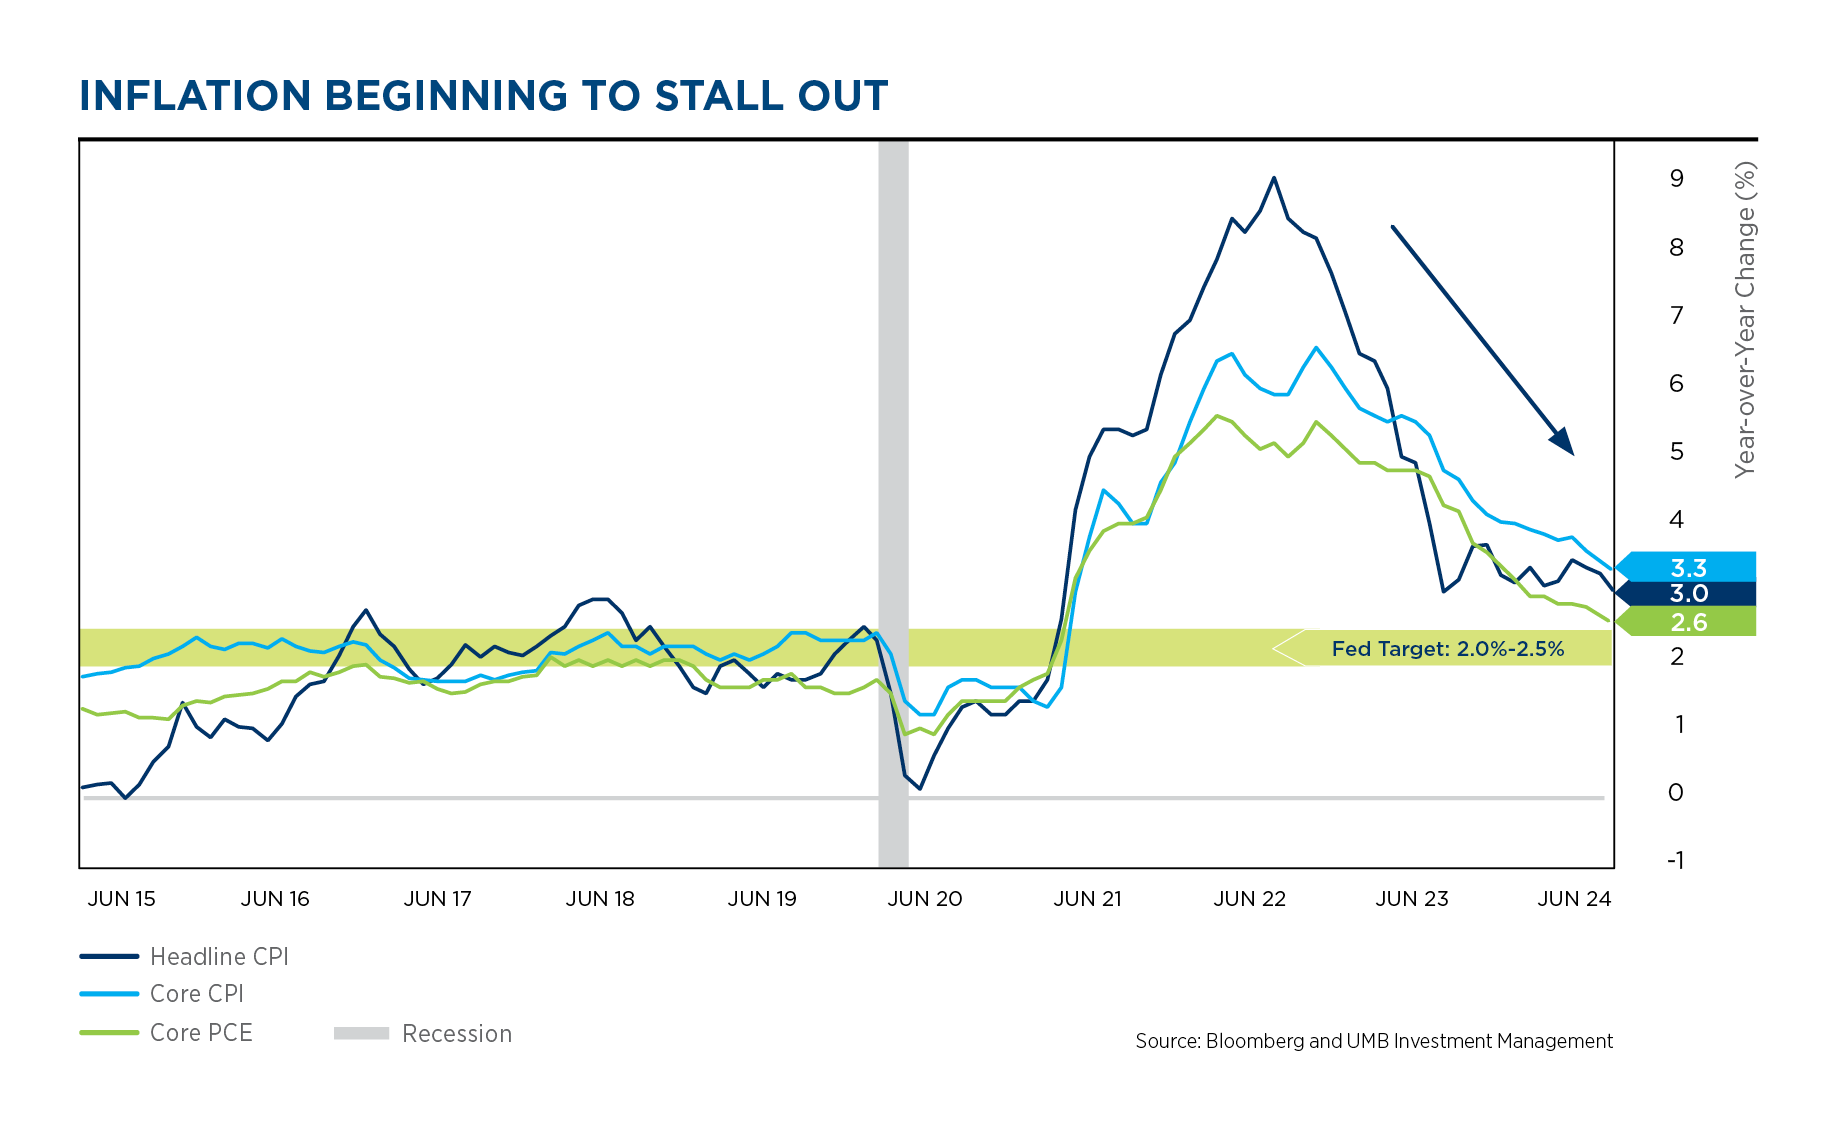
- Most measures of inflation have resumed their slow march lower, while still remaining well above the Fed’s stated target.
- Inflation has always been difficult to manage with any degree of precision, and this cycle is no different.
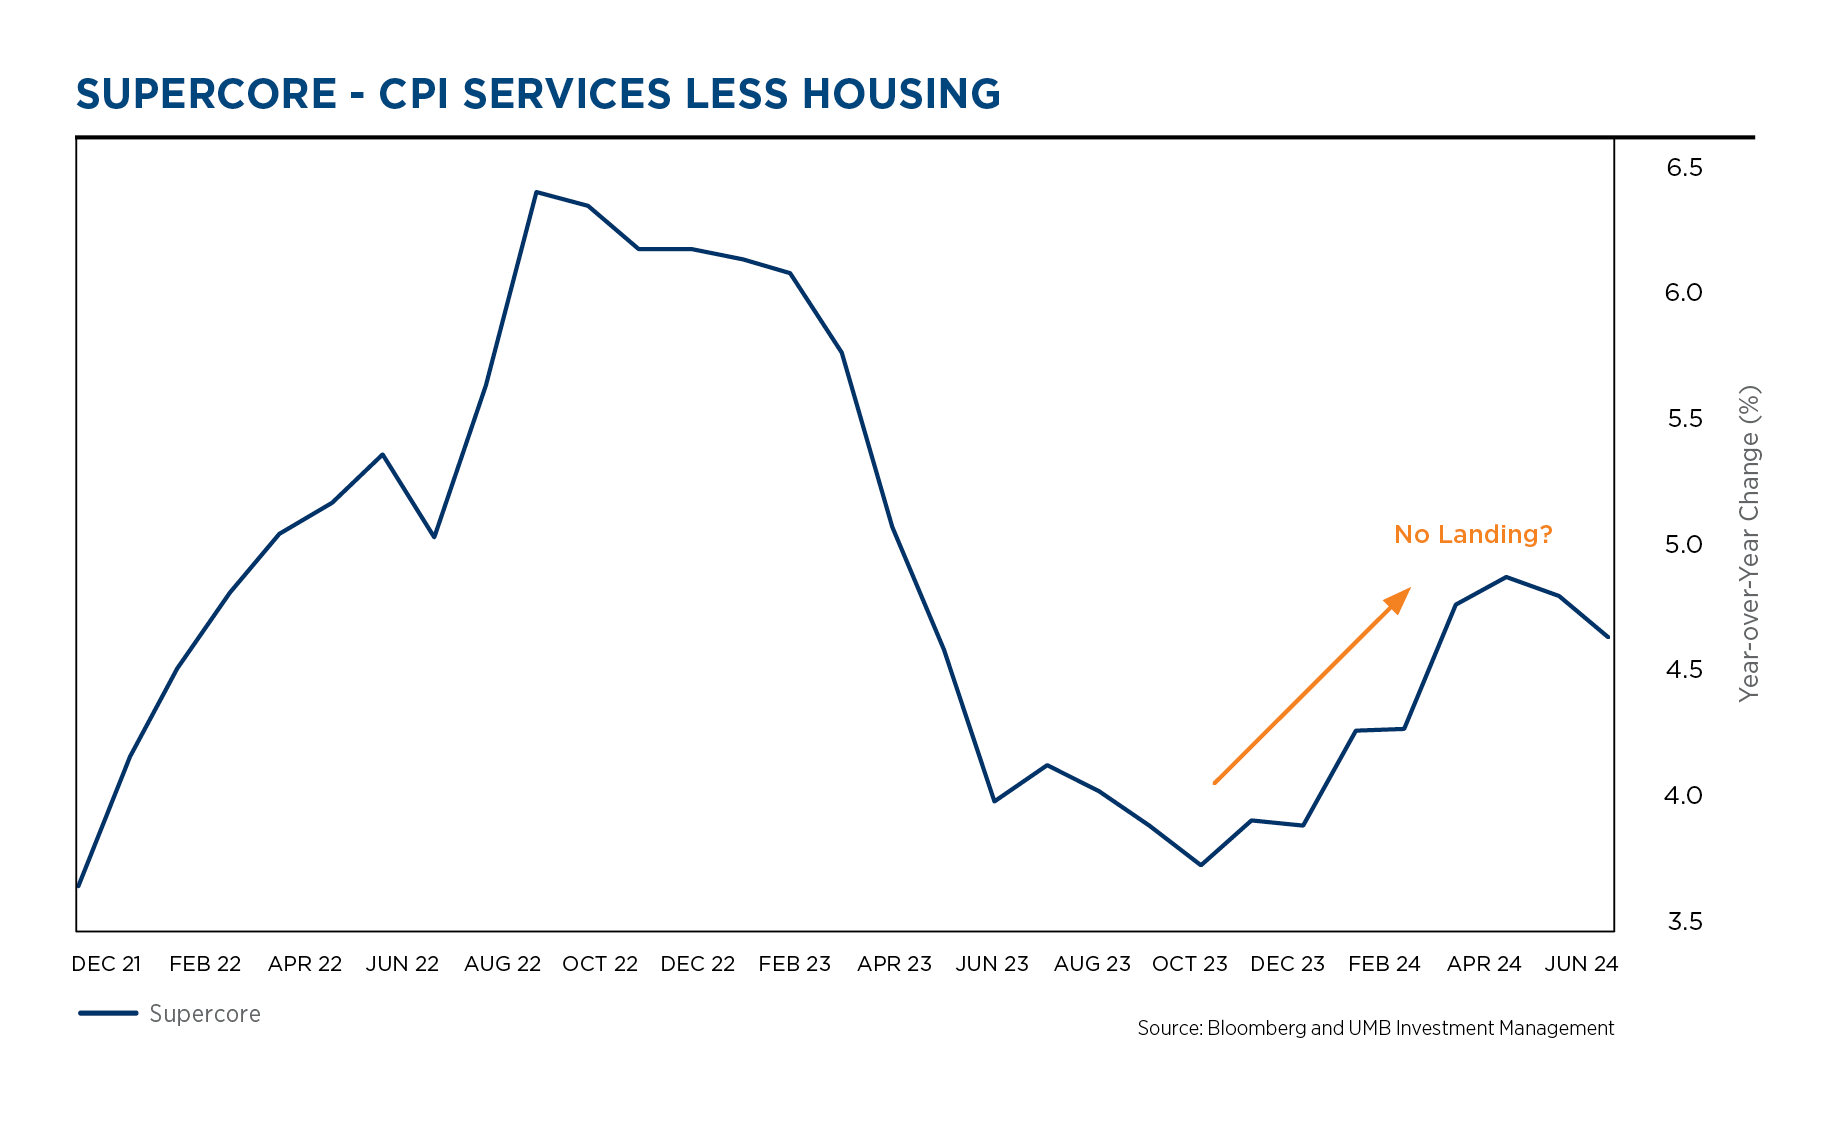
- Supercore Inflation, one of the Fed’s current favorite measures, has been rising steadily for many months. Its ascent was finally interrupted in the last 30 days, and there are hopes that it will begin a long path lower.
- The various versions of Supercore inflation track services, while excluding goods, food, energy and shelter. Being focused on services these measure of inflation are highly dependent on the labor market and wages. The tight labor market appears to have kept wages firmer than anticipated, resulting in recent increases in this important measure of inflation.
- We anticipate ongoing cooling of the labor market as the year progresses, which should help move this measure back towards the Fed target.
- If this variable fails to establish a clear downtrend, the Fed may be unable to initiate rate cuts in the manner the market expects.
Household savings and consumption
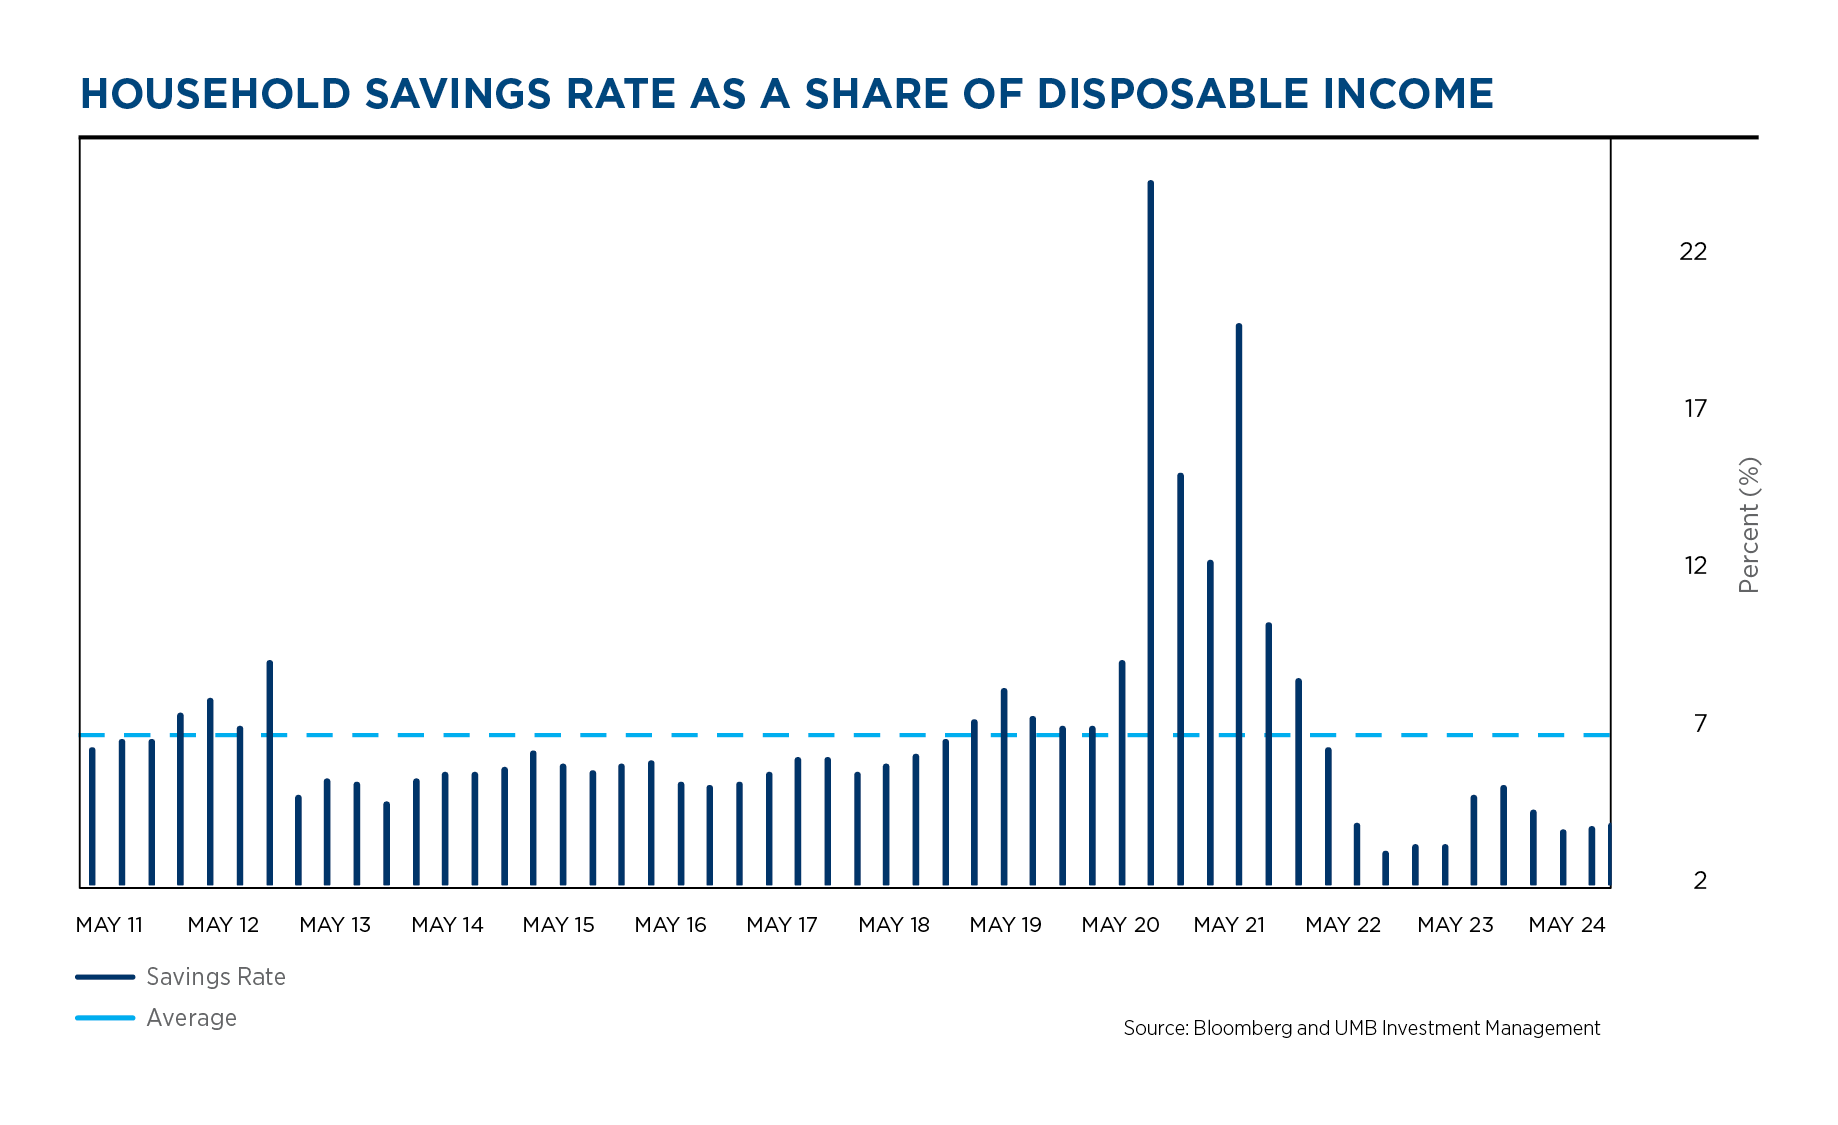
- Recent consumption trends have been accompanied by a severe drop in the savings rate.
- Household savings rates have collapsed to nearly the lowest levels in US history.
- Excess savings from the pandemic years helped households feel more comfortable reducing their monthly savings patterns.
- The excess Covid savings are now depleted (see above).
- Savings rates must return to normal, and that will require reduced consumption.
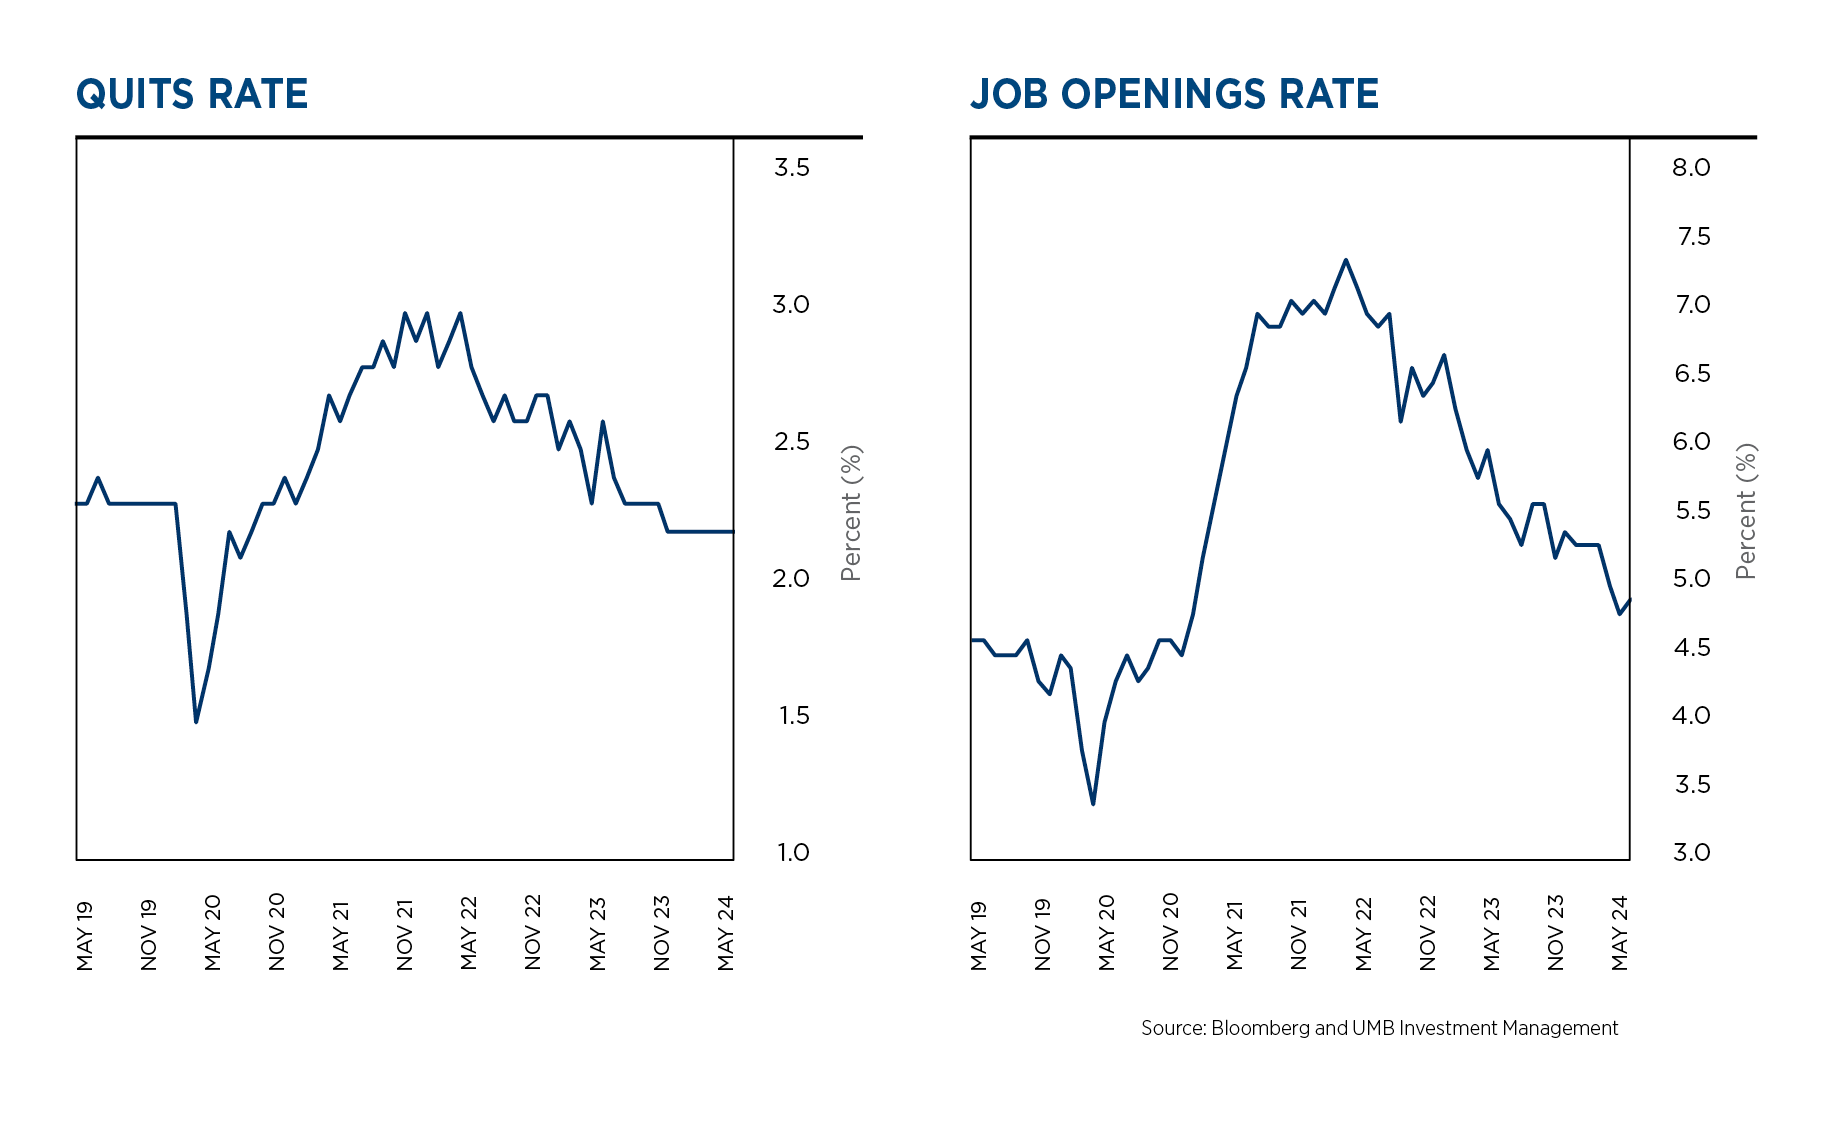
- Leading indicators from the labor market continue to point to a slow-down later in the year.
- Multiple data points from the labor market have been steadily falling for several months, indicating softness in the system.
- The Quits Rate (those voluntarily separating from jobs) has fallen to a level well below where it was before the pandemic.
- The Job Openings rate has traced a similar path and is nearly to its pre-pandemic readings.
- These, and numerous other leading indicators are signaling that the labor market will be softening, with unemployment rising, as the year progresses.
- Softening labor markets traditionally lead to lower wage growth.
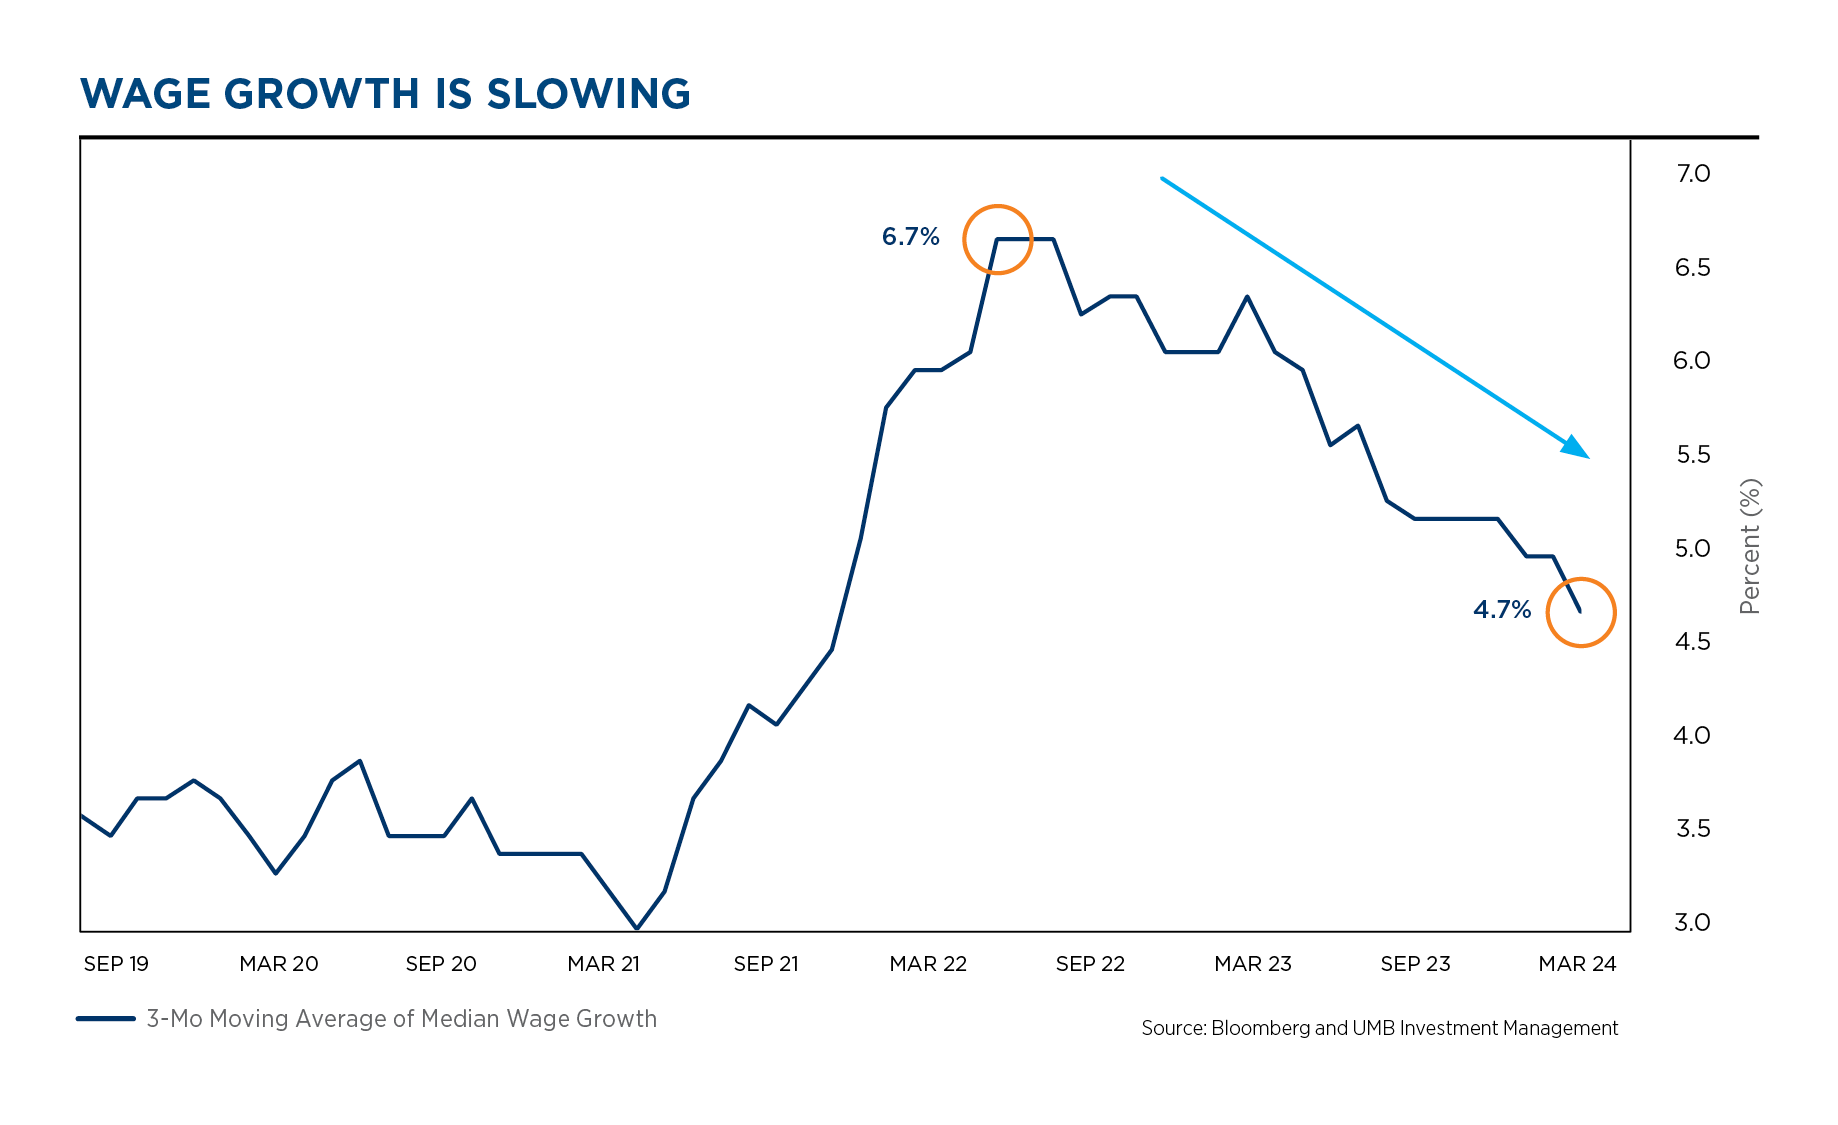
- Wage growth has been decelerating, in line with the softening of the labor market.
- Wage growth is softening, but still well above normal levels. This has been a key driver of consumption, GPD growth and inflation.
- If/when the labor market softens further, wage growth should drop to more normal levels. This should help bring inflation closer to the Fed’s target.
- Slowing of wage growth leads to lower consumption, and lower GDP growth rates.
- If households begin to use leverage to fuel consumption (as a replacement for wage growth), then the inflation issue could persist.
Credit market soft landings
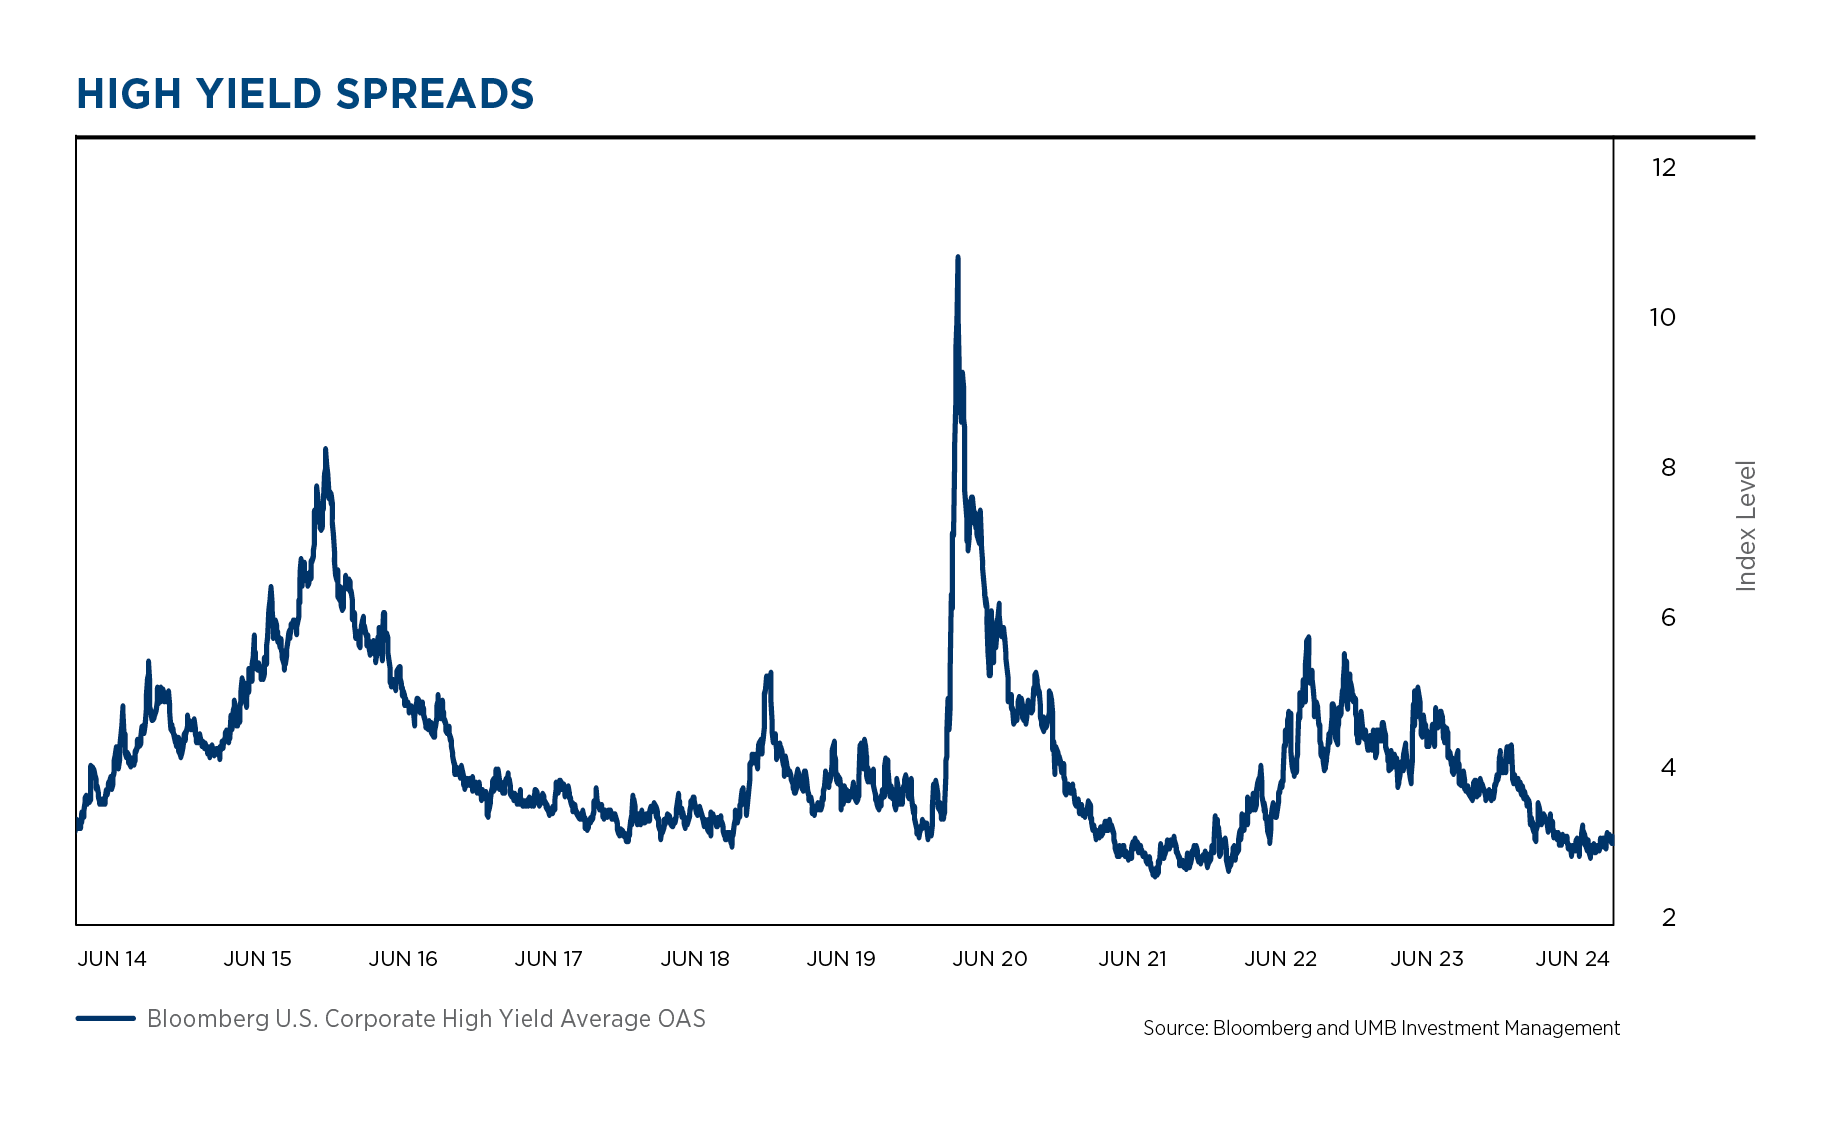
- Credit markets are riding the coat tails of the equity markets.
- Credit spreads are near the lowest ranges of the last several cycles.
- This valuation implies a nearly perfect outcome for the economy and credit markets, and leaves little (or no) room for any upside surprises in default rates.
- Credit markets appear to be positioned for a perfect soft landing, with no below-trend cycle for the US economy.
- We are cautious on valuations in this space, given that we do not foresee a soft landing as the most likely outcome for the US.
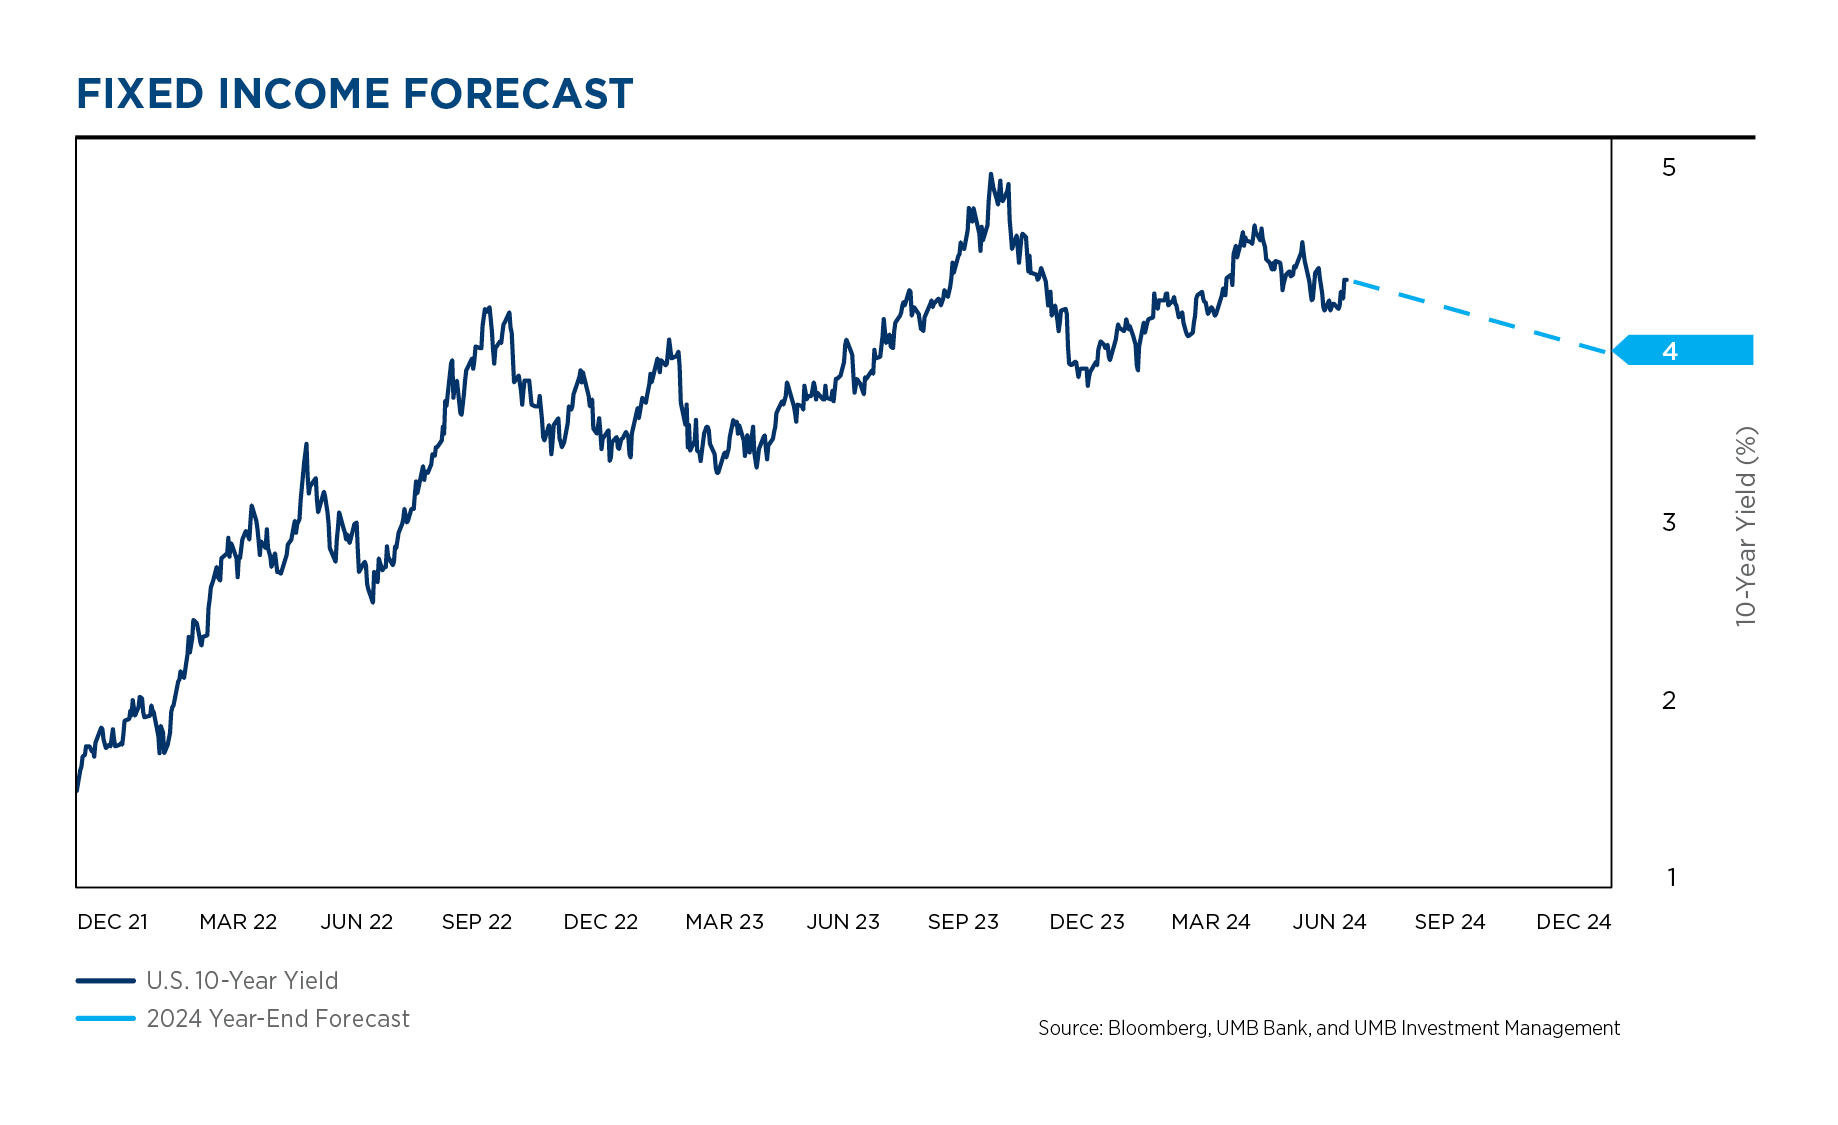
- Interest rates were pushed higher in the first quarter due to stubborn inflation data.
- Long rates are positioning for some uncertainty surrounding the outlook for Fed rate cuts, and the uncertain path for inflation.
- Rates have moved back up to reasonable valuations, given our outlook for a softer economy and lower rates later in the year.
- Full allocations to fixed income are appropriate.
- The growing risk of “no landing”, with sticky inflation and perhaps the consideration of even higher rates, is keeping us cautious about extending duration or going overweight fixed income at this time.
Election insights
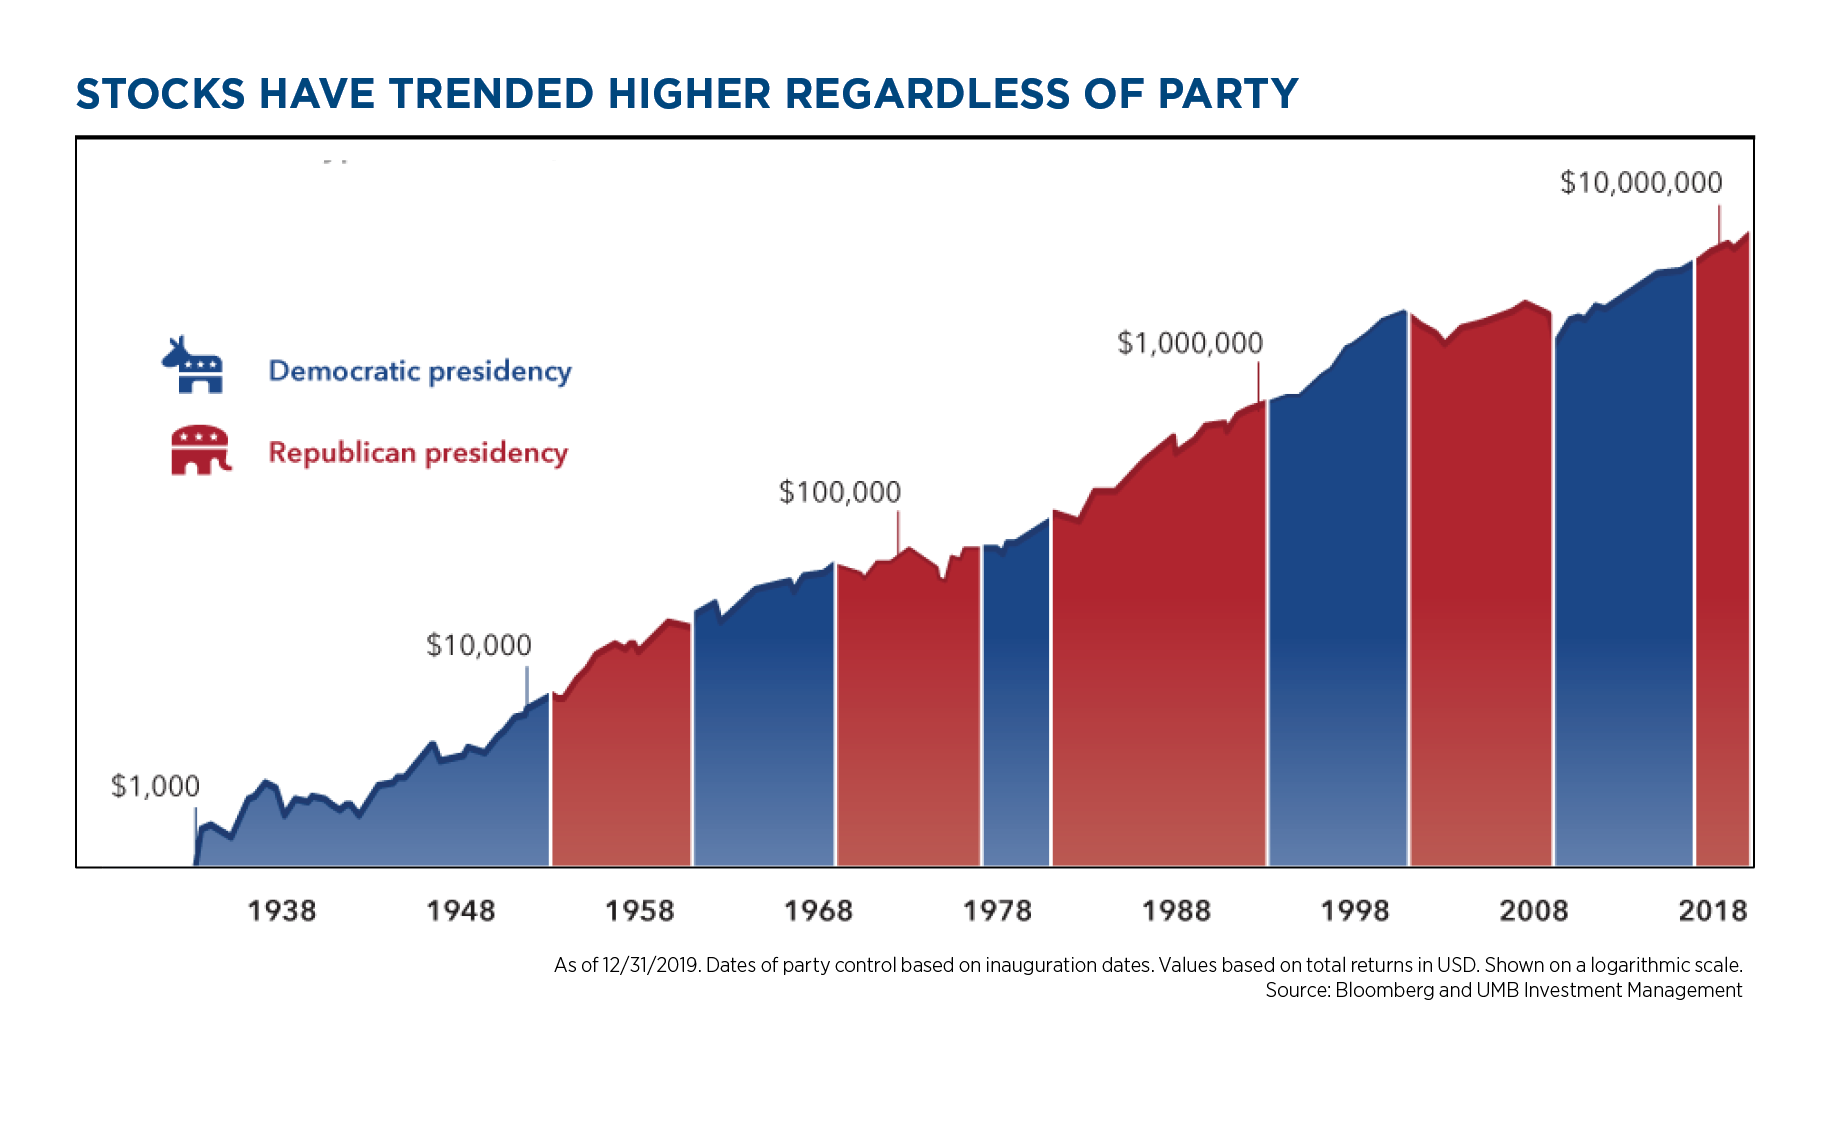
- Historical data show us that election outcomes do not have clearly identifiable impacts on the markets.
- The chart to the left is one of man charts on this topic, and it is virtually impossible to find clear correlation between election outcomes and market outcomes.
- Historically, red waves tend to be correlated with lower taxes and regulation, and blue waves typically bring higher amounts of both. But the economy and markets have marched steadily higher despite either of those situations for many decades and we do not foresee that trend changing based on this single upcoming election.
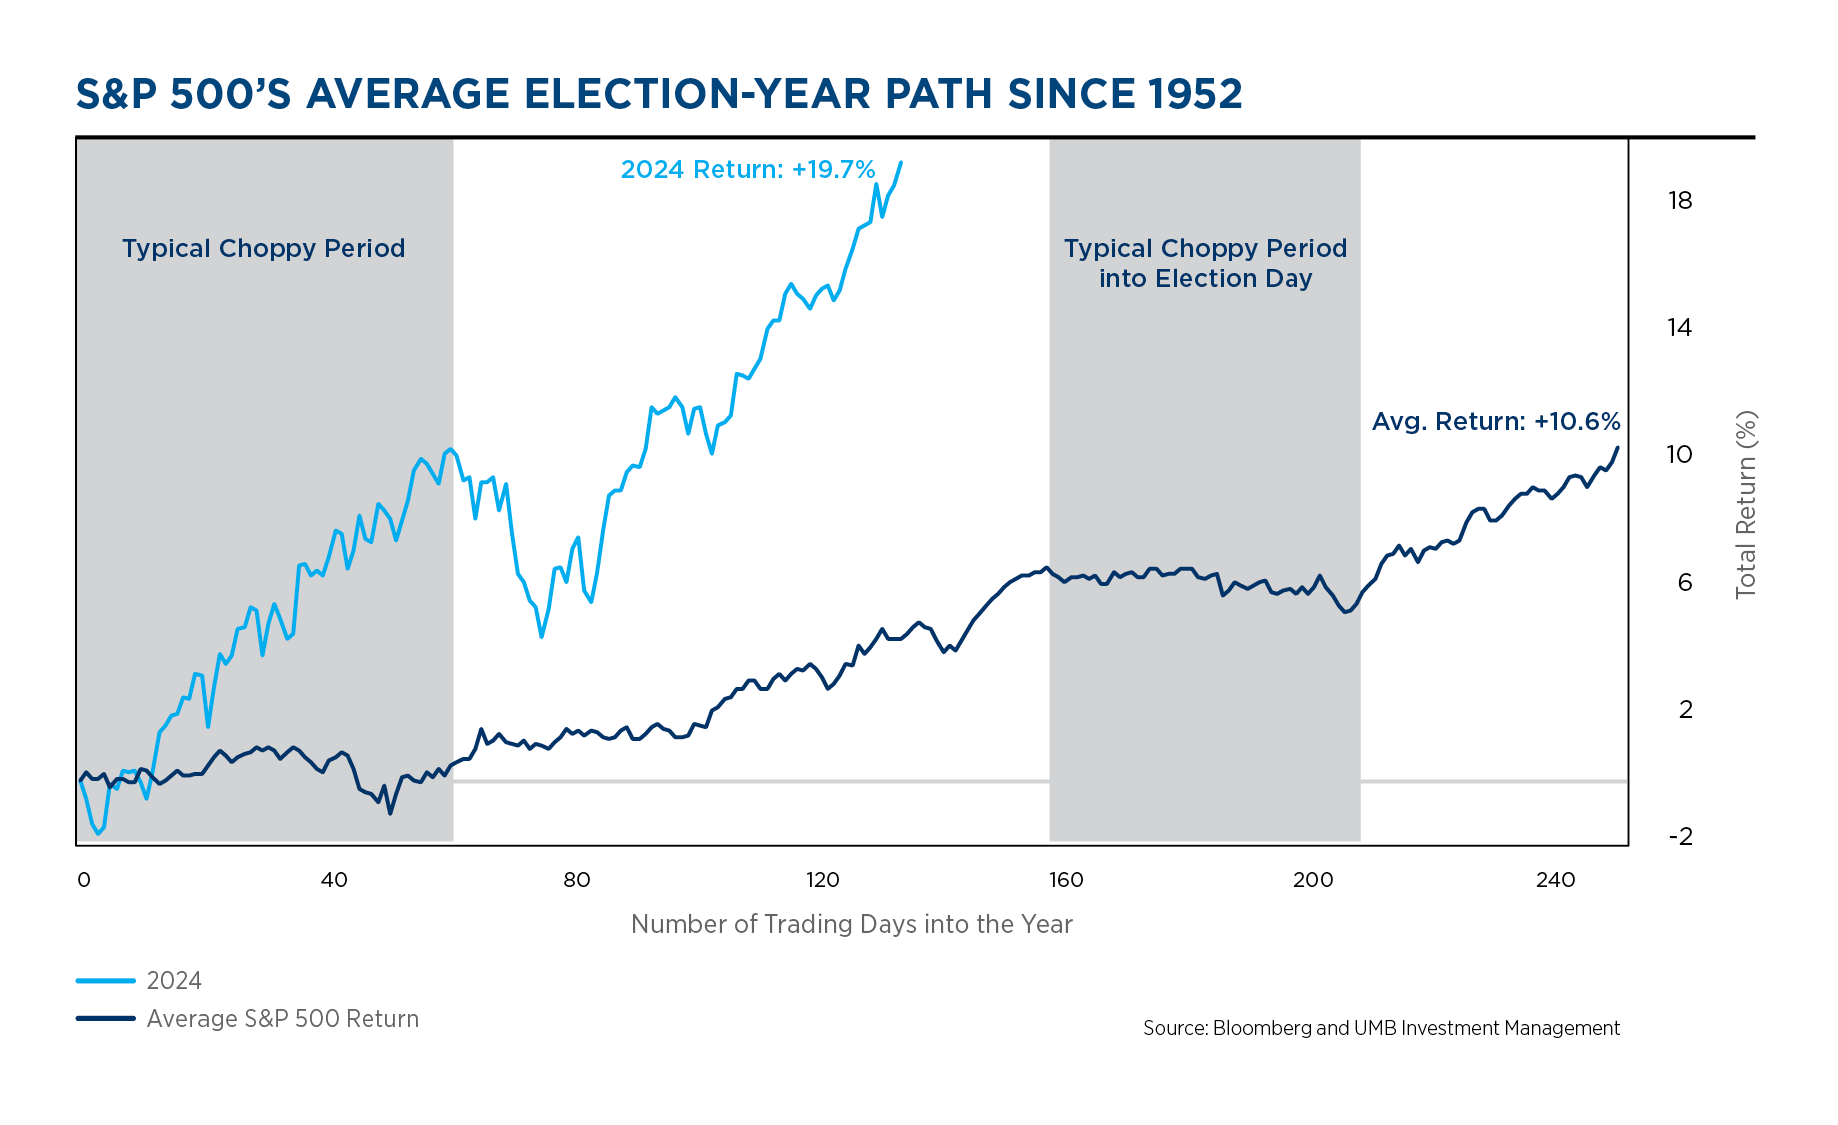
- While history shows us whichever party is in office has had little impact on long-term market performance, there’s one short-term pattern that tends to persist – Increased volatility in an election year.
- We are quite surprised about how little volatility has occurred thus far in 2024. The equity markets have marched higher in a nearly un-interrupted fashion.
- So far, the focus has been more on what the Federal Reserve is up to rather than who will occupy the White House in 2025. However, we expect the emotional turmoil that typically erupts around politics may cause some added market volatility over the next several months. Given the contentious nature of the current campaign and the distinct possibility that unprecedented changes to the candidates on the ballots will take place, we would expect increased volatility as we move closer to the election.
- Many strategists believe that since both candidates are already well known, the overall uncertainty is lower this time. This may be why we haven’t seen 2024 play out like most election years, but the candidate options appear to be “fluid” at this time, so heightened volatility seems to be a certainty later in the year.
Follow UMB‡ on LinkedIn to stay informed of the latest economic trends.
When you click links marked with the “‡” symbol, you will leave UMB’s website and go to websites that are not controlled by or affiliated with UMB. We have provided these links for your convenience. However, we do not endorse or guarantee any products or services you may view on other sites. Other websites may not follow the same privacy policies and security procedures that UMB does, so please review their policies and procedures carefully.
Disclosure and Important Considerations
UMB Investment Management is a division within UMB Bank, n.a. that manages active portfolios for employee benefit plans, endowments and foundations, fiduciary accounts and individuals. UMB Financial Services, Inc.* is a wholly owned subsidiary of UMB Financial Corporation and an affiliate of UMB Bank, n.a. UMB Bank, n.a., is a subsidiary of UMB Financial Corporation.
This report is provided for informational purposes only and contains no investment advice or recommendations to buy or sell any specific securities. Statements in this report are based on the opinions of UMB Investment Management and the information available at the time this report was published.
All opinions represent UMB Investment Management’s judgments as of the date of this report and are subject to change at any time without notice. You should not use this report as a substitute for your own judgment, and you should consult professional advisors before making any tax, legal, financial planning or investment decisions. This report contains no investment recommendations, and you should not interpret the statements in this report as investment, tax, legal, or financial planning advice. UMB Investment Management obtained information used in this report from third-party sources it believes to be reliable, but this information is not necessarily comprehensive and UMB Investment Management does not guarantee that it is accurate.
All investments involve risk, including the possible loss of principal. Past performance is no guarantee of future results. Neither UMB Investment Management nor its affiliates, directors, officers, employees or agents accepts any liability for any loss or damage arising out of your use of all or any part of this report.
“UMB” – Reg. U.S. Pat. & Tm. Off. Copyright © 2024. UMB Financial Corporation. All Rights Reserved.
- Securities offered through UMB Financial Services, Inc. Member FINRA, SIPC, or the UMB Bank, n.a. Capital Markets Division
Insurance products offered through UMB Insurance Inc.
You may not have an account with all of these entities.
Contact your UMB representative if you have any questions.
| Securities and Insurance products are:
Not FDIC Insured * No Bank Guarantee * Not a Deposit * Not Insured by any Government Agency * May Lose Value |


