
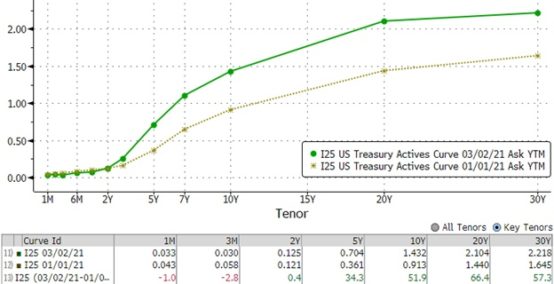
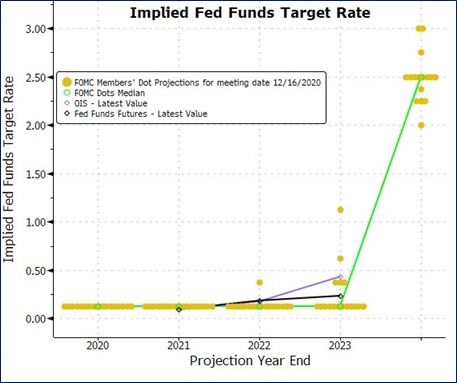
Mid-way through the first quarter of 2021 one thing is clear: the yield curve is steepening. The following charts illustrate the movement in rates during the past two months. As is expected, the FOMC anchored at the zero lower bound results in a two-year and shorter tenor of the curve that barely budged. Also anticipated, inflation to begin showing signs in multiple data points resulting in a +50 basis points (bps) sell off in the 10-year to 30-year tenor of the curve.
During the past 12 months, rates dropped further than many ever imagined possible and stayed there longer than we thought they might. Hence, this first quarter change in the curve may find you pondering just where to best deploy the excess liquidity that – like many banks across the county – is sitting on your balance sheet. The following paragraphs will provide a few simple observations regarding the agency, mortgage-backed securities (MBS), and municipal offerings in this steepening rate environment.
MBS:
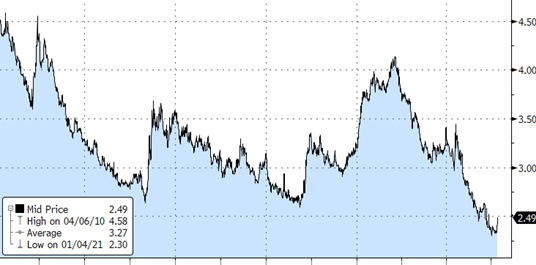
The national mortgage rates dropped by about 100 bps on both the 15-year and 30-year term during the last 12 months. With mortgages in the money to be refinanced, many locked in lower rates. As a direct result, the prepayment speeds accelerated at the very same time that pandemic lockdowns and stimulus significantly increased cash on bank balance sheets and emergency FOMC action dropped interest rates lower than ever seen before. Due to the resetting of the fixed income market, the dollar prices on MBS soared – especially when the Fed started buying $80 million a month. This increased amortization, and, with accelerated prepayments, it also increased the likelihood that your monthly interest earned was less than the amortization cost in any given month. Several variables created a uniquely volatile market.
While some banks opt to avoid MBS, the yields available on short duration instruments keep mortgage-backed securities as a key component of bank portfolios. The immediate return of principal one of MBS’s key advantages. Particularly, with the UST curve shifting significantly the return of principal can be more valuable than at any point in the last three years.
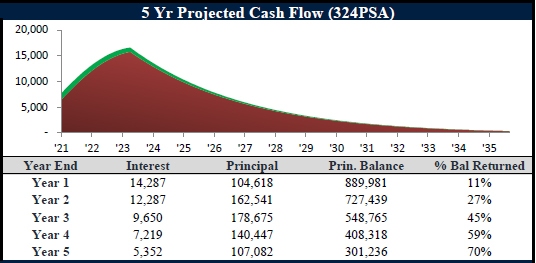
When prepayments accelerate, the average life of an MBS shortens. Often this creates a mismatch between the amortization schedule of a bond and the timing at which principal is completely returned. To avoid the unamortized balances on an MBS security, a lower coupon is encouraged. In fact, this year new issues carried coupons lower than ever. I suggest either the 15-year 1.5c or the 20-year 1.5c pool. If prices continue their recent trend moving to a 2.00% coupon to increase interest income in a decelerated prepayment scenario. A dollar price below $103 decreases the amortization associated with that CUSIP and often allows for symmetrical yield / life relationships as prepayments accelerate and slight improvements in interest income when the prepayments slow.
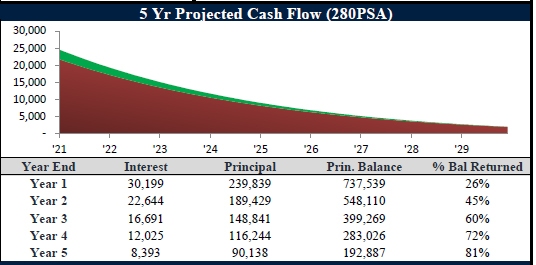
The following tables summarize a 15-year 1.5c and 15-year 3.5c. Both are new issues. Clearly, the 1.5c provides both the yield and stable prepayment advantage. Perhaps the only reason the higher coupon would be preferred is to increase the likelihood of an accelerated prepayment versus the slightly longer extension that occurs on the 1.5c.
|
G2 MA7219 1.5 SF MBS 15yr |
||||||
| 147PSA | 173PSA | 219PSA | 324PSA | 752PSA | 1184PSA | 1285PSA |
| 1.140 | 1.122 | 1.090 | 1.014 | 0.710 | 0.436 | 0.376 |
| 5.65 | 5.37 | 4.93 | 4.13 | 2.50 | 1.85 | 1.75 |
five year projected cash flow 1
|
FN FM6172 3.5 CI MBS 15yr |
||||||
| 208PSA | 228PSA | 244PSA | 280PSA | 328PSA | 373PSA | 404PSA |
| 0.821 | 0.735 | 0.665 | 0.502 | 0.274 | 0.049 | -0.113 |
| 3.37 | 3.26 | 3.17 | 2.99 | 2.76 | 2.57 | 2.45 |
five year projected cash flow 280PSA 2
15-year national mortgage rates since 2010
Limited risk and strategic return: A common theme for agency bonds.
While the shorter end of the curve remains anchored down, we are seeing many investors start to consider the step-up feature of an agency bond. Step-up agencies allow you to take advantage of the safety of bond payments while also benefiting from interest rate rises because the coupon or interest payment increases over the life of the bond. Even better, if rates fall, the coupon payment will still increase.
As the curve continues to steepen, take a moment to weigh the cost benefit of these structures versus fixed coupons. Especially as we are seeing step-ups being issued more frequently in recent months.
The two most compelling arguments for these types of coupons:
- A strong focus on controlling the timing of your cash flow
- Factoring in a potential rate hike before 2025. If that is the case, you won’t miss out on higher rates like you may with a fixed coupon structure.
Step-ups generally provide a higher WAC versus fixed coupon instruments with similar maturities. One thing to note is that when bonds steps-up, the likelihood of the issuer to exercise the call also increases.
Agency bond tax feature
A question that we see regularly is regarding the tax feature of agency bonds. The interest income from agency bonds are subject to both federal and state taxes. Interest on certain agencies, including ones issued by FHLB, and FFCB, is exempt from state taxes.
Municipal Bonds: A ladder approach in a rising rate environment.
With short term rates staying lower for longer and a steepening of the yield curve, we favor a ladder approach targeting 10-20-year range in municipal bonds. There is opportunity cost sitting in near zero-yielding cash. Couple with the difficulty of forecasting interest rate movements for “timing” the market, a ladder investment strategy helps alleviate these problems. As bonds mature, rising rates provide the opportunity to reinvest proceeds at higher yields. The result would generate a higher book yield and income over time.
Looking further into 2021, there is a potential area of opportunity to invest in lower Investment Grade General Obligation and/or Essential Service Revenue Bonds. After very negative credit outlooks in spring of 2020, credit quality has remained stable. Furthermore, in the latter half of this year as states continue to re-open and with a successful vaccine rollout, we should see state and local government budget constraints decrease. With lower quality investment grade bonds where spread has widened, and performance is still lagging higher quality municipal bonds during this recovery, we view this as a relatively attractive market as seen in the chart below.

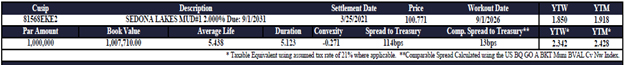
One structure to consider laddering in both taxable and tax-exempt municipal bonds would be a 10-20-year cushion callable with 2.0%+ cpn and 5-year lockout. Additionally, we see relative value in issuers of municipal utility districts (MUDs). MUDs are political subdivisions authorized under the Texas Constitution to levy taxes, charge for services, and issue debt for infrastructure such as water, sewer, and drainage. They typically pick 10-20 bps versus high grades, carry underlying ratings BBB to A, and insured by AGM (AA/A2) or BAM (AA). Texas MUD bonds are an excellent fixed-income option for investors looking to a ladder strategy while capturing more yield in their municipal portfolio. See below for an example of a recent TX MUD issuance we had.
![]()
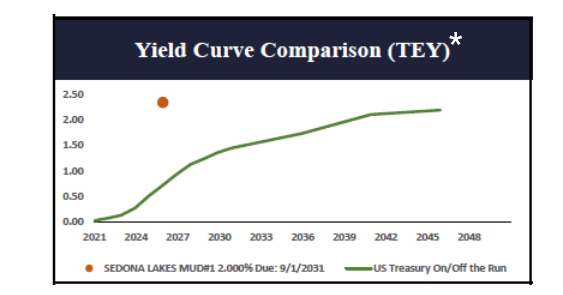 *The tax equivalent yield (TEY) is calculated on an assumed 21% tax rate unless otherwise noted.
In conclusion, we expect higher rates and a continued steepening of the yield curve for 2021. The recovery should be good for lower-rated municipal bond issuers, Callable Agencies (Fixed & Step Coupons), and lower 1.5% cpn 15-year and 20-year MBS bonds to outperform.
UMB Bank Capital Markets Division delivers a comprehensive suite of solutions, including market data and modeling, technology platforms and fixed income sales. Visit umb.com to learn how our fixed income sales and trading solutions can support your bank or organization, or contact us to be connected with an investment banking team member.
All images and charts in this article are sourced from Bloomberg.
This communication is provided for informational purposes only. UMB Bank, n.a., UMB Financial Services, Inc. and UMB Financial Corporation are not liable for any errors, omissions, or misstatements. This is not an offer or solicitation for the purchase or sale of any financial instrument, nor a solicitation to participate in any trading strategy, nor an official confirmation of any transaction. The information is believed to be reliable, but we do not warrant its completeness or accuracy. Past performance is no indication of future results. The numbers cited are for illustrative purposes only. UMB Financial Corporation, its affiliates, and its employees are not in the business of providing tax or legal advice. Any materials or tax‐related statements are not intended or written to be used, and cannot be used or relied upon, by any such taxpayer for the purpose of avoiding tax penalties. Any such taxpayer should seek advice based on the taxpayer’s particular circumstances from an independent tax advisor. The opinions expressed herein are those of the author and do not necessarily represent the opinions of UMB Bank, n.a., UMB Financial Services, Inc. or UMB Financial Corporation.
Products offered through UMB Bank, n.a. Capital Markets Division and UMB Financial Services, Inc. are:
NOT FDIC INSURED | MAY LOSE VALUE | NOT BANK GUARANTEED