To help clients prepare for the year ahead, we thought it would be beneficial to share some dynamic options for balance sheet models we run for banks for budgeting and planning seasons. These models provide an idea of what rate sensitivity analysis could look like if banks wanted to compare different scenarios with different balance sheet totals.
As the Fed looks at cutting interest rates over the next couple of years, it’s crucial to consider several different scenarios for your bank and plan accordingly.
2024 recap
This past year included a presidential election and two rate cuts, moving the target range between 4.50 and 4.75 – both factors that can create some market shifts. The graph below shows the Effective Fed Funds Rate, represented by the blue line. The grayish shade is the target range, and the black line is the volume in billions.

*Source: New York Fed website as of November 25, 2024
The likelihood of additional rate cuts has yet to be determined and will most likely be determined by how much the country continues to see inflation cool. We have seen the Consumer Price Index creep closer to the 2% target rate, which could lead to more rate cuts in 2025. Additionally, it’s likely the economy and interest rates will be impacted by the new administration’s policies and we should watch how quickly the markets react.
Looking ahead to 2025
As you prepare for the next year, reviewing potential scenarios for loans, deposits, and net interest margin will help lead the discussion on dynamic balance sheet possibilities for your bank.
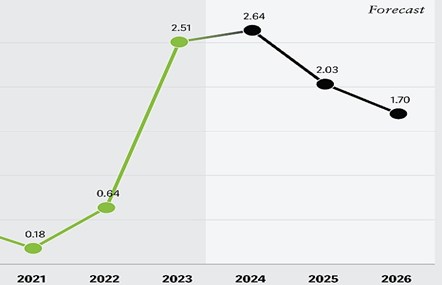
Per estimates from experts in the capital markets and banking industry, it wouldn’t be surprising to see net interest income decline slightly in 2025 as deposit costs remain relatively high. Even as rates start dropping, the cost of interest-bearing deposits may not react as quickly. This comes from the fact that most banks demand liquidity, and most depositors do not want to accept lower deposit rates. Naturally, this could cause a competition for deposit rates between banks as customers seek the highest possible rate for their money. The image below from S&P Global Market Intelligence shows a forecast for deposit rates in the next couple of years.

**Source: Deloitte Center for Financial Services Estimates and S&P Global Market Intelligence
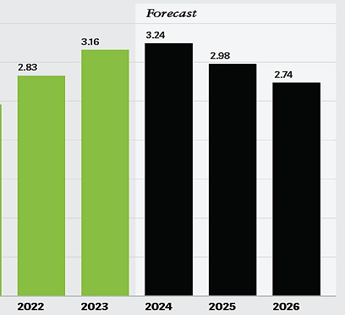
Loan demand is expected to improve in 2025, especially for mortgages as consumer demand for homes will increase alongside rate drops. Credit card debt and auto loan/installment loans may experience slower growth because consumers will face different financial pressures. Below is a graph of forecasted net interest margins over the next couple of years, similar to the previous chart. This shows how important it will be for bank asset liability management (ALM) committees to strike a good balance between loan and deposit rates.

Source: Deloitte Center for Financial Services Estimates and S&P Global Market Intelligence
Dynamic balance sheet modeling
Since the 2025 outlook will be so important in developing a balance between loan and deposit rates, banks will start seeing consumers doing different things with their money, such as moving out of deposits and investing the money elsewhere. Or they may keep their money in deposits through 2025 and see what happens to the markets. Using dynamic modeling can help banks forecast growth or decline in certain accounts to predict possible impacts to the balance sheet.
The static model approach – which is the most commonly used amongst banks — stipulates that all account balances remain unchanged over the simulation horizon. Any balances that mature or roll off during that period are replaced on the balance sheet using the terms and structure specified in the reinvestment assumptions.
In contrast, dynamic balance sheet modeling considers the current state of the balance sheet as well as any possible changes in the asset-liability mix, which are brought on by anticipated changes in the bank’s market or planned changes envisioned by bank leadership.
While the static balance sheet approach will satisfy a regulatory requirement, using a dynamic balance sheet approach from time to time can better inform decision-making. In our models, we can create scenarios ranging from loan growth all the way to showing the effects of non-maturity deposit runoff (or both).
Another benefit of using a dynamic balance sheet approach is that it helps you look at situations when you may be out of policy in certain rate scenarios or getting close to being out of policy. We can change the asset-liability mix and make adjustments to see what improvement can be made to move the bank back into policy.
Let’s look at an example to show exactly what this means. We currently have a client who would like to see how a non-maturity deposit runoff every quarter will affect their rate sensitivity analysis results. They typically provide a certain dollar amount they want to see runoff their balance sheet. We modify the balance total in our model to show the effect this will have compared to their original reports that used the static balance sheet approach. As you can see from the balance sheet screenshot below, they ran off $7,708,000 in non-maturity deposits this quarter.

*Source: FSG RSA report
The results didn’t change much from one scenario to another, demonstrating what would happen if they saw a sudden increase or decrease in their deposits. As mentioned earlier, the same scenario can be run for your investment portfolio, loans, time deposits, etc.
There are no restrictions on the changes you can make to your specific balance sheet categories. The only restriction is your imagination. We can model the most drastic situations as well as basic shifts. We can use a specific dollar amount to run off (or add growth) immediately or a percentage growth or decline over a specified period.
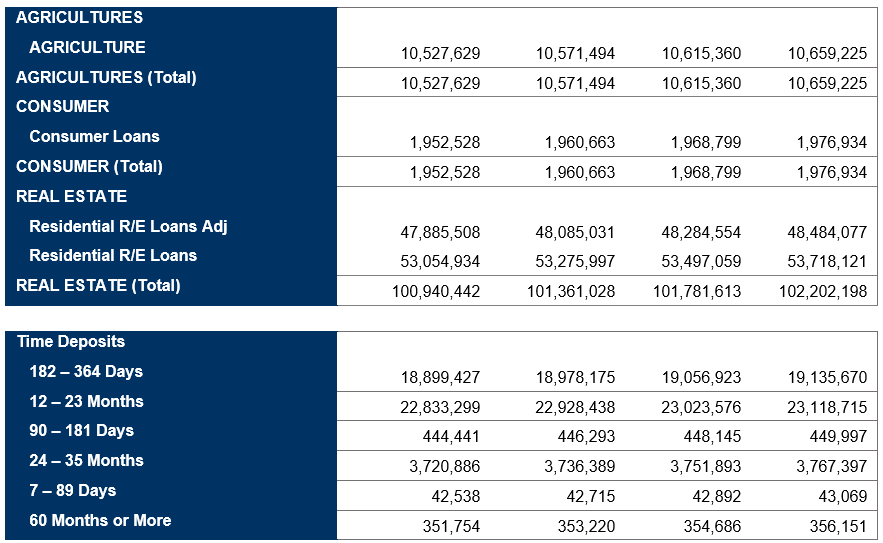
Let’s look at another dynamic balance sheet modeling scenario some clients have used. Instead of an instantaneous dollar amount runoff or growth, the client wanted a percentage increase in their loan portfolio and deposits over a specified period. In this instance, they requested their entire balance sheet grow at a rate of 5% over a full calendar year, or about 0.42% a month. Looking at a snippet of their balance sheet below, you can see the changes in those totals.

*Source: FSG RSA report
They also made some instantaneous dollar amount changes to specific categories. We showed that scenario earlier, so we wanted to show the option of percentage changes over a specific period. Again, this won’t significantly change your report unless you make drastic changes. The whole point of this modeling exercise is to plan and review what your balance sheet could look like at a time frame in the future.
Conclusion
The drastic changes in interest rates in the last few years have caused banks to rethink the composition of their balance sheets. Consider dynamic balance sheet modeling to help you and your team better understand the potential impacts in several custom scenarios.
Learn how UMB Bank Capital Markets Division’s asset liability management and performance consulting can support your bank or organization, or contact us to be connected with a team member.
Disclosure
This communication is provided for informational purposes only. UMB Bank, n.a. and UMB Financial Corporation are not liable for any errors, omissions, or misstatements. This is not an offer or solicitation for the purchase or sale of any financial instrument, nor a solicitation to participate in any trading strategy, nor an official confirmation of any transaction. The information is believed to be reliable, but we do not warrant its completeness or accuracy. Past performance is no indication of future results. The numbers cited are for illustrative purposes only. UMB Financial Corporation, its affiliates, and its employees are not in the business of providing tax or legal advice. Any materials or tax‐related statements are not intended or written to be used, and cannot be used or relied upon, by any such taxpayer for the purpose of avoiding tax penalties. Any such taxpayer should seek advice based on the taxpayer’s particular circumstances from an independent tax advisor. The opinions expressed herein are those of the author and do not necessarily represent the opinions of UMB Bank or UMB Financial Corporation.
Products, Services and Securities offered through UMB Bank, n.a. Capital Markets Division are:
NOT FDIC INSURED | MAY LOSE VALUE | NOT BANK GUARANTEED


