
In December 2025, UMB Fund Services and FUSE Research Network published Interval and Tender-Offer Funds Moving Mainstream: $200 Billion and Beyond, our latest analysis of the unlisted closed-end fund market.
The figures in that report ran through the second quarter of 2025. Here, we share data updated to the end of 2025—in the context of market stresses that have tested these products so far in 2026.
First, the structures kept scaling through the second half of the year. Interval and tender-offer funds combined reached approximately $239 billion in assets under management at year-end 2025, up from $207 billion at mid-year—an addition of roughly $32 billion in six months.
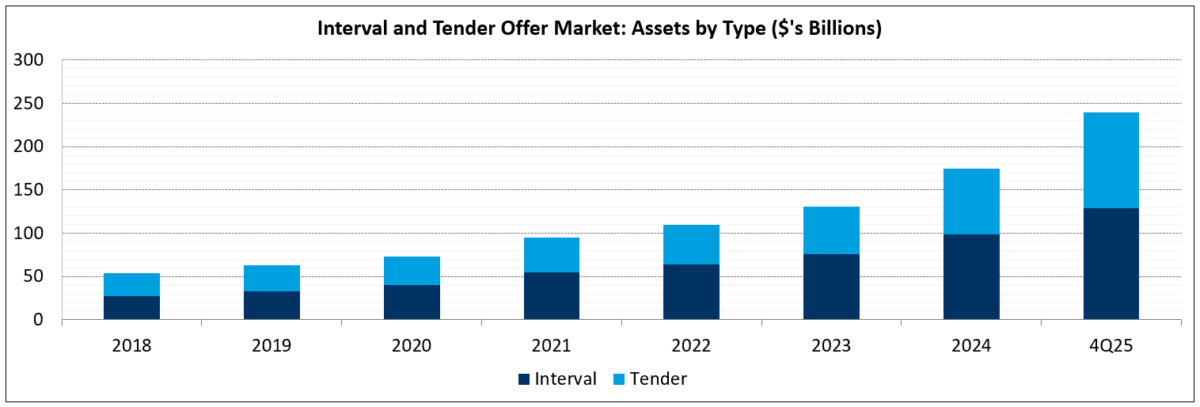 Source: FUSE Research Network
Second, since year-end, these vehicles and the broader family of semi-liquid alternative wrappers, including non-traded business development companies (BDCs), have entered the first meaningful liquidity test the category has faced since reaching scale. The structural design of these vehicles anticipates exactly this kind of period.
How the structural mechanics work
Interval funds and tender-offer funds are 1940 Act registered investment companies that hold portfolios of less-liquid assets (such as private credit, private equity, real assets) and offer periodic, capped liquidity rather than daily redemptions.
A typical interval fund prospectus requires the fund to repurchase at least 5% of outstanding shares each quarter when investor requests reach that threshold, and in many structures the board has discretion to extend the repurchase to as much as 7%. When requests exceed the cap, redemptions are filled pro rata, and the remainder waits for the next quarterly window. Tender-offer funds operate similarly, but with greater board discretion over the timing and size of tenders.
These caps are not workarounds invoked under stress. They are prospectus terms, disclosed at the time of investment, that exist to prevent forced selling into a thin secondary market, which would harm remaining shareholders. When repurchase caps engage as written, the mechanism is doing what it was built to do.
Year-end 2025 in detail
Updated data through the fourth quarter of 2025 shows:
- Interval funds grew to approximately $128.7 billion, with credit and income strategies remaining the dominant category at roughly $88.8 billion.
- Tender-offer funds grew to approximately $110.4 billion, with alternative strategies — primarily private equity — accounting for roughly $88.8 billion of that total.
- Tender-offer funds added more assets than interval funds in the second half of 2025, reflecting continued allocator appetite for long-duration private equity exposure delivered in a registered wrapper.
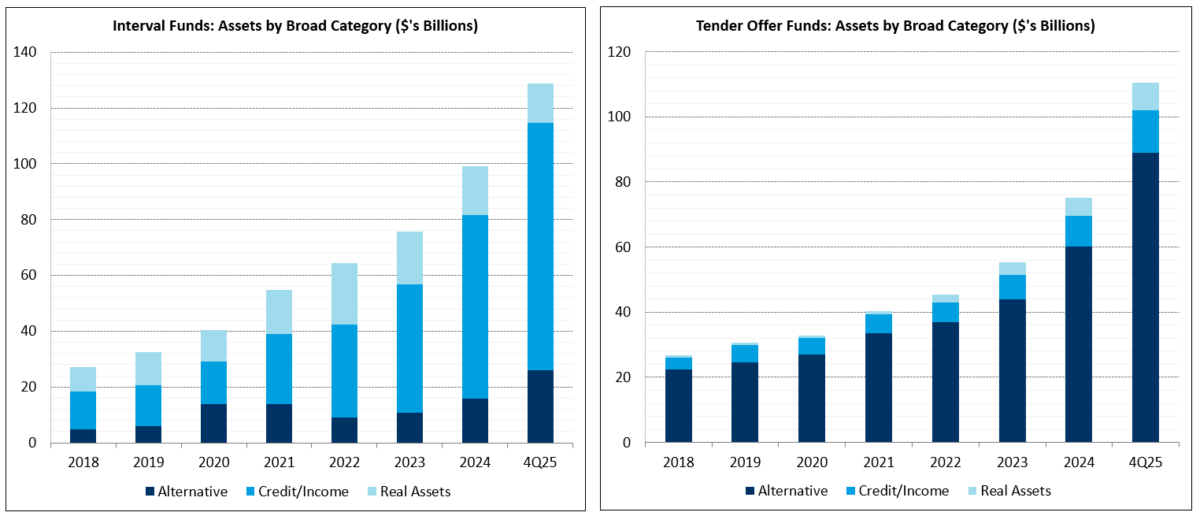 Source: FUSE Research Network
Looking ahead
The data tells us that capital was committed into these structures right up to the period of stress. What the current test will reveal, over the coming quarters, is how the structures perform under the conditions they were built to address.
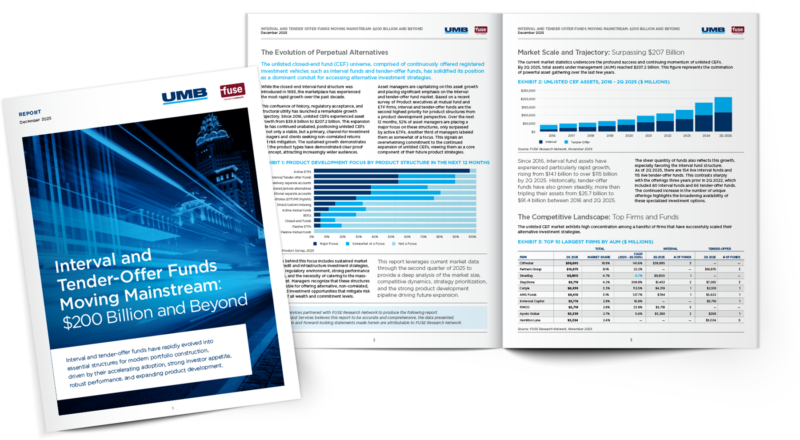
Access the full report for an analysis of market dynamics, top managers, fees and product pipeline.
Learn more about UMB Fund Services and how we can support your firm’s registered and alternative investment fund servicing needs, or contact us to be connected with a fund services team member.
When you click links marked with the “‡” symbol, you will leave UMB’s website and go to websites that are not controlled by or affiliated with UMB. We have provided these links for your convenience. However, we do not endorse or guarantee any products or services you may view on other sites. Other websites may not follow the same privacy policies and security procedures that UMB does, so please review their policies and procedures carefully.