Banks have seen a surge in deposits from the pandemic which has left them flush with cash. However, with rates on the rise, banks should prepare for a runoff in deposits.
Non-maturity deposit (NMD) accounts can be difficult to model as they do not have contractual cash flows or maturity dates. We have tools in place to better understand bank-specific depositor and pricing behavior in various market rate environments. These results can better assist banks in developing strategies on pricing their NMDs.
Interest rates on the rise
A year ago, the Fed Funds Target Rate was 0 to 25 basis points. At the March 2022 Federal Open Market Committee (FOMC) meeting, the committee decided to raise the target range for the federal funds rate to 25 to 50 basis points and anticipated that ongoing increases would be appropriate. The rate increase is to pursue the committee’s goal to achieve maximum employment and 2% inflation rate.
Over the course of 2022, we have seen an increase in the target range at each meeting. At the July 2022 meeting, the committee decided to raise target range for the federal funds rate to 2.25 to 2.5%. Their focus is on inflation as the unemployment rate has returned to its pre-pandemic level of 3.5%, as of July 2022. The committee continues to anticipate ongoing increases which was emphasized by Federal Reserve (Fed) Chairman Jerome Powell’s speech at Jackson Hole in August. He mentioned another unusually large increase, like the two, 75-basis point increases we’ve seen this year, could be appropriate at their next meeting.
The next FOMC meeting will be held September 20-21, 2022, with two more meetings scheduled for this year. On August 31, Cleveland Federal Reserve President Loretta Mester shared her view that it will be necessary to move the fed funds rate somewhat above 4% by early next year and hold it there. She does not anticipate cutting the fed funds target rate next year.
Deposit behavior
The pressure on deposit pricing is starting to pick up and we can expect this to continue as the Fed is expected to raise rates. Although the first Fed rate hike was in March, deposit prices lagged and didn’t start moving till the end of the second quarter, see figure 1 below. As of August 15, the national deposit rates for savings was 0.13, interest checking 0.03, and money market 0.14. The national rate is the average of rates paid by all FDIC-insured depository institutions and credit unions with available data, with rates weighted by each institution share of domestic deposits, these rates are updated monthly.
Figure 1: National Deposit Rates
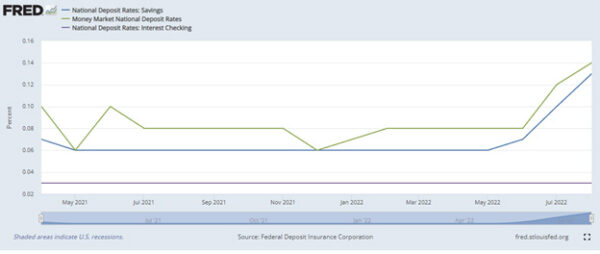
Source: Federal Deposit Insurance Corporation
Since the COVID-19 pandemic, banks experienced an unprecedented surge in deposits. Total deposits at domestic commercial banks have increased to $18 trillion, which represents 37% growth from December 2019. This was driven by rapid drawdown in commercial and industrial (C&I) lines of credit by firms seeking precautionary liquidity, Federal Reserve’s asset purchases, fiscal stimulus that increased household incomes, and higher personal savings rates due to uncertainty in the labor market.
As stimulus has ended and aggressive tightening by the Federal Reserve continues, we may see a shift in deposits. The latest data shows that deposit growth has slowed down and remaining relatively flat, see figure 2 below.
Figure 2: Deposits, All Commercial Banks

Source: Board of Governors of the Federal Reserve System (US)
Figure 3: Deposit Composition
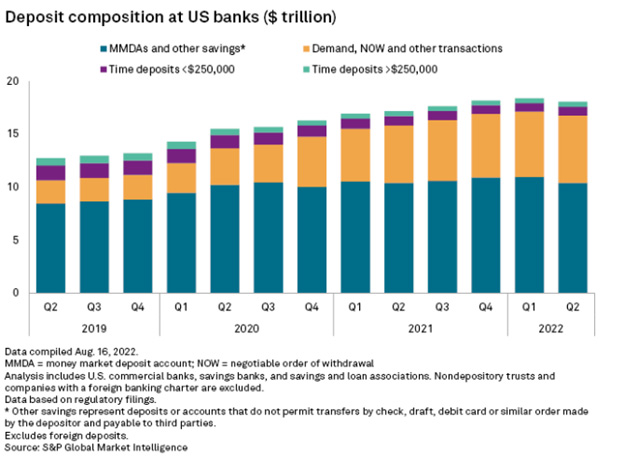
Over the past several years, bank deposits have trended upward, see figure 3. In the second quarter of 2022, deposits dipped. As market rates increase, we may see a shift in deposit composition. There may likely be runoff in surge deposits from the pandemic as depositors seek higher paying products and competition between banks heats up.
On the other side of the balance sheet, we have seen significant changes as well. Banks have experienced a pickup in loan growth year-over-year and quarter-over-quarter. The excess liquidity on hand has allowed banks to meet loan demand while deposits are starting to runoff. As rates pickup liquidity tolerance should be evaluated and tested.
Tools to develop deposit pricing strategies
As the Fed continues to raise rates this puts pressure on banks to look at their deposit pricing strategy. Rising rates could significantly hurt a bank that is extremely liability sensitive. The questions that bank Asset-Liability Committee (ALCO) are faced with is when to raise rates and by how much. There are tools in place to assist your bank with getting started and making decisions on pricing your deposit products.
Core deposit analysis
Let’s start by analyzing your past deposit behavior in various rate environments. Our team of analysts can run a core deposit analysis to compute your bank specific betas, decay rates, and lags. The beta portion of the study focuses on the historical relationship between your non-maturity deposit account rates and market benchmark rates over rising and falling interest rate cycles.
We run multiple time-series regression analyses to find the highest R-squared value. The greater the R-squared value, the better predictive power of forecasting rate change. Once we pinpoint the highest R-squared value we can assign a lag and beta value to the NMD account.
The beta is the magnitude of change is deposits in response to 100-basis-point change in market rates. The time lag estimates how long it takes the deposit rates to respond in changes to market rates, this is represented in days or months. These results can give insight as to how your bank responds to rising market rates to prepare you for future market rate increases.
The second portion of the analysis focuses on NMD decay rates. We study past behavior of deposits with respect to change in interest rates. These results are used to predict future deposit behavior and core funding.
NMD stress test
We recommend stress testing NMD assumptions at least annually. As mentioned earlier, studying past behavior is a good place to start but we can’t always depend on historical results to predict future behavior.
In this scenario we double decay table values, reduce lags to zero, and double beta values. This is to prepare the bank for immediate and extreme deposit rate movements. With these results we can measure the impact on changing repricing assumptions for NMD accounts on the banks earnings at risk and economic value of equity.
Liquidity stress test
Banks have sufficient liquidity but that could change soon. To prepare for sudden unexpected deposit withdrawals banks should run scenarios to better understand future risks and exposures. We recommend running a liquidity stress test at least annually and at different magnitudes.
In this scenario we select a percentage of NMD balances to runoff for a given period. Next, we apply funding sources to cover immediate liquidity needs – Fed Funds Sold/Excess Balance Account, FHLB Borrowings, selling investments, etc. We review results and identify whether the bank is within policy under various rate scenarios for earnings at risk and economic value of equity.
A change in the interest rate environment presents new challenges for banks as they navigate how to price deposits. With forecasting tools, we have a baseline of possible outcomes that can help banks establish a strategy. We can test these strategies to find a risk versus return position the bank is comfortable with.
Learn how UMB Bank Capital Markets Division’s fixed income sales and trading solutions can support your bank or organization, or contact us to be connected with a team member.