Tipping Points?
Despite some serious macroeconomic challenges, the U.S. economy continues to drive forward at a very healthy rate. Third quarter growth is expected to be well above normal (perhaps as high as 2.8%), and longer-term estimates point towards slightly above average growth rates for the foreseeable future. This is due in large part to the incredible economic stimulus coming from the ongoing build-out of the AI infrastructure. Data center construction is proving to be a massive stimulus to the U.S. economy and is helping to drive both consumption and earnings growth. Consequently, the U.S. stock market has weathered the geopolitical storms in strong fashion, with very healthy double-digit returns for the year to date.
The third quarter of 2026 left many market observers concerned that our macroeconomic environment might be reaching multiple possible tipping points:
- Significantly higher U.S. interest rates are perhaps the most significant issue at the moment. Our markets have experienced one of the largest quarterly increases in interest rates in the last several decades. This led to industry analysts flooding the airwaves with comparisons to the interest-rate spikes experienced during the 1990s.
- Diesel fuel prices also ignited numerous heavy conversations during the quarter. Due to supply disruptions in the Middle East and Russia, combined with refining constraints here in the U.S., diesel fuel reached an all-time high in mid-September. Sustained diesel prices in this range are feared to be threatening “demand destruction” if or when those historic prices get pushed through the supply chain to end users (households).
Both interest rates and diesel fuel prices are tied to the ongoing issues with the war in Iran and the flow of crude oil through the Strait of Hormuz. Official resolution of the conflict is an on-again/off-again situation, and the war between Russia and Ukraine has joined the narrative, due to destruction of Russian refining capacity.
We’re also facing concerns with the K-Shaped Economy, impending elections, and the massive AI construction wave.
Following are our more detailed comments on the potential tipping points mentioned above:
Top Current Concern – Interest Rates (Inflation)
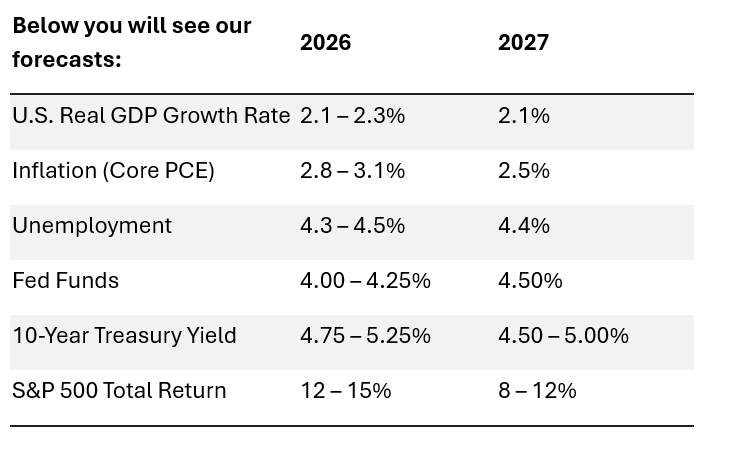
U.S. Treasury rates have experienced an eye-opening (some would say alarming) increase over recent months. Rates had drifted lower throughout most of 2024 and 2025, before experiencing a sharp rise in 2026. Due to inflation running well above the Federal Reserve’s target (3.0% versus target of 2.0%), the Federal Open Market Committee has embarked on a tightening campaign, which started in September. The Fed is expressing an intention to hike overnight rates one or two more times over the next year, which they consider a “mild” tightening cycle. The Fed tightening cycle, plus inflation fears (tied to issues with oil) have pushed longer-term rates sharply higher this year, particularly in the third quarter. 10-year Treasury rates spiked to multi-decade highs (of about 5.30%) as the market began to price in geopolitical uncertainty and ongoing inflation concerns.
Breaching the 5% barrier on the 10-year has caused some analysts to fear that we have entered a “danger zone” for the economy and equity markets. However, we would be quick to remind everyone that most of the last two decades were spent in an interest-rate environment that many would say was artificially low, due to several major rounds of quantitative easing (QE). Since 2008, our central government had used the balance sheet of the Federal Reserve to force interest rates lower than they otherwise would have been under normal market conditions. We are now experiencing what could easily be referred to as a “normalization” of interest rates, back to levels that would have prevailed had we not deliberately forced rates lower during the Global Financial Crisis (2008) and the COVID-19 crisis (2020). We have moved back to a more normal economic environment, with solid growth, but also inflation concerns. Additionally, our new Fed Chair would much rather sell treasury debt than buy it (he’s not a fan of QE).
Consequently, interest rates have risen sharply to reflect these ongoing uncertainties – but they have simply moved back up to what were very normal rates before the era of QE (5% or higher).
There are many voices comparing our current cycle to those of the 1990s. During that decade there were multiple periods where interest rates spiked sharply. However, on the three different occasions when longer-term treasury rates spiked between +1.50% and +2.50%, none of those interest rate increases turned out to be tipping points for the economy/markets. Much like today, the 90s economy was very healthy and expanding in a way that was driving inflation higher and interest rates were rising in response to strong economic growth. In all three rising-rate periods of the 90s, the economy maintained very healthy growth patterns, despite the increased rates. Additionally, the stock market enjoyed fantastic earnings growth and posted quite handsome returns (flat during first rate spike, powerfully higher during next two – see table below).
The bottom line: the 90s were a prime example of an economy that was enjoying very healthy expansion, coupled with strong earnings growth, and was therefore able to thrive during multiple periods of rapidly increasing interest rates – which we believe is similar to our environment today. Current GDP growth rates are lower than those in the 90s, to be sure, but interest rates are also starting at a MUCH lower level and will remain well below the peaks from those periods (in both nominal and real terms).
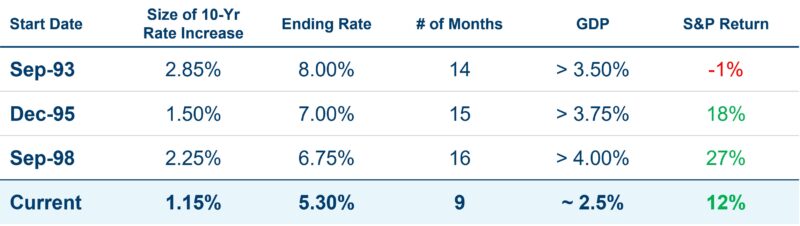
To be clear, the stock market will not perpetually ignore treasury rates that push continually higher – but the markets can likely tolerate moderately higher rates (from where we are now). However, we do not believe there is a meaningful risk of sharply higher rates. There are early signs that inflation is starting to abate, and it appears that crude oil is beginning to move more freely from the Middle East (next section). We think that rates are likely to peak somewhere near current levels – an opinion held by most major research firms.
Energy Prices
Recent increases in inflation and interest rates are inextricably tied to the conflicts in the Middle East and Russia/Ukraine and the resulting disruptions to crude oil and refined product (especially diesel fuel) supply.
Crude Oil
Recent data suggest that total crude oil exports out of the Middle East (excluding Iranian production) have rebounded to levels close to those experienced prior to the conflict with Iran. This progress is due to expanded usage of alternative routes out of the Middle East for crude oil, including the East-West Pipeline in Saudi Arabia. As a result of this flexibility, crude oil prices have dropped from cyclical highs and are currently fairly stable in $88 per barrel range¹.
Diesel Fuel
In contrast, global diesel fuel infrastructure is far less flexible and dynamic. Refining capacity in the United States has been constrained for many decades due to environmental concerns, capital intensity, construction backlogs, and poor estimated long-term returns on capital. Outside of the U.S., the world’s largest diesel exporter, Russia, has lost approximately 50% of its diesel refining capacity since the beginning of the conflict with Ukraine. Pile onto that the disruption of shipping traffic through the Strait of Hormuz, and we have a perfect storm for diesel that has resulted in record-high prices of $6.50 per gallon – igniting discussion of a potential tipping point in the Energy markets.
Inflation
Many participants in manufacturing and distribution have yet to pass through the significantly higher diesel prices to consumers, but credible research suggests that higher prices may start to trickle down the supply chain in coming months. This could worsen overall inflation, in contrast to what the Fed has been predicting. As we write this update, there are numerous strategic initiatives being discussed to help bring diesel prices down (i.e. restricting diesel exports), but that effort is politically charged and could exacerbate an already difficult situation.
Despite these issues, the futures markets for both crude oil and diesel fuel continue to imply that the market believes the current crisis will be rectified in the near to intermediate term. Oil forward prices gradually fall towards $80/bbl over time, and the diesel futures market is highly inverted (future delivery prices for diesel are significantly lower than today’s prices). We are encouraged that the financial markets believe that the global supply shock will be solved, but of course there are major political forces controlling this narrative.
Stock Market/ AI
As mentioned in the opening section, strong economic activity and powerful earnings growth persisted throughout the third quarter despite challenges from oil and interest rates. The S&P 500 ended the quarter with a gain of 2.30%, taking year-to-date returns to 12.75%. The build-out of AI data centers is driving exceptionally strong economic activity, as well as powerful earnings growth within the S&P 500. We are firm believers that the AI construction miracle still has a long runway ahead of it. Even the strongest detractors from the long-term AI theme concede that we are very likely in the early innings of this story. Construction backlogs are large and the ongoing economic stimulus from data center construction is likely to stretch throughout 2027 and into 2028. The data center construction boom is a central driver behind virtually unanimous forecasts of longer-term economic growth at or above long-term averages (2.0% or higher GDP growth).
Over the longer term, we will almost certainly encounter a tipping point within the AI theme, when market participants demand hard evidence that the AI build out is delivering strong productivity gains (and higher profits) throughout the economy. We are still in the construction phase of this amazing cycle, but the time will come for the “second phase” where the investment must start delivering returns. We believe this time will likely come as we head into 2028 – the current phase has quite a bit of room to run.
K-Shaped Economy and Elections
Powerful market returns continue to highlight the ongoing underlying issues associated with the bifurcation of wealth and income within the United States—the K-shaped economy. America is one of the most affluent nations in the world, but within those very high averages exists a wide gap between higher- and lower-income households. Each move higher in the equity markets can further widen the difference in measured wealth between these groups, given the concentration of equity ownership among higher-income households.
America is the most dynamic, growth-focused large economy in the world, attracting innovative companies, entrepreneurs and workers. Within such a free-market system, variances in economic outcomes are both encouraged and expected. This is not necessarily an issue from a purely economic perspective; proponents of free markets would argue that these disparities reflect a system that rewards investment, innovation, and risk-taking. However, the magnitude of the disparity has begun to contribute to social and political angst in many corners of society.
It may also influence the policy debate during upcoming elections. The K-shaped economy has become an important theme for many candidates and policymakers. We are careful not to express political opinions in our communications, but the upcoming elections may take on a “tipping point” tone in the media. Prediction Markets currently think there’s a meaningful probability of a change in control of one or both chambers of Congress. When prediction markets speak, we listen, as these markets have recently become among the most closely watched indicators of electoral expectations.
Regardless of the outcome, historical experience suggests that election outcomes have very little correlation to subsequent economic and market performance. While policy changes can affect particular sectors or industries, broader forces—including earnings, monetary policy, fiscal policy, productivity and global conditions—typically play a more significant role in determining market and economic outcomes.
The markets appear to have already prepared for a potential switch in Congress, so we do not foresee any lasting market turbulence if this occurs in early November. Fortunately, the U.S. economy tends to follow its own cycles regardless of the ebb and flow of power in Washington. We do not expect to make any changes to our investment themes based solely on the election outcome, while continuing to evaluate policy developments and market conditions as additional information becomes available.
Risks to the Outlook
The primary risk to our view is quite clear – a long-term period of elevated oil/gasoline prices that causes inflation to remain stuck above 3.00% well into 2027. If this were to occur, the Fed narrative would have to change from expecting a “mild” tightening cycle, to a more aggressive move higher for overnight rates. This could cause another big spike in longer-term rates, which would likely unleash equity market volatility – and possibly severely impact economic activity. This is not our base-case view at this time. Recent data points to a softening of inflation over the next several months. The Fed is forecasting a relatively significant drop in inflation throughout 2027 – and most global forecasting firms concur. The futures market for crude oil and diesel indicate steadily lower prices throughout the upcoming year, which should support the outlook for lower inflation and rates. If political forces keep energy prices high for too long; financial market volatility may become the trigger that forces resolution of the conflict. We do not see this as the most likely outcome, but it is the primary risk to our view.
What it Means for our Clients
We continue to marvel at the incredible resilience of the U.S. economy and markets despite all the macroeconomic challenges we currently face. We are cautiously optimistic that the powerful trends currently driving our economy will continue to push us forward as the Energy conflict reaches resolution. Regardless of the impending election results, we foresee a reasonably fruitful environment for the next 12-24 months and are therefore continuing to maintain a modest overweight to U.S. Equities. Our bias towards Quality equity holdings should help smooth the ride if any volatility erupts. In coming weeks/months, we will consider leaning into the opportunities within the Fixed Income space – higher yields have brought us income/return opportunities that we haven’t seen in nearly 20 years.
We will keep a very close watch on the global economic and political landscape for signs of genuine economic tipping points but will move forward expecting reasonably good outcomes over the intermediate horizon.
Inflation Pushes the Fed into “Mild” Tightening Campaign
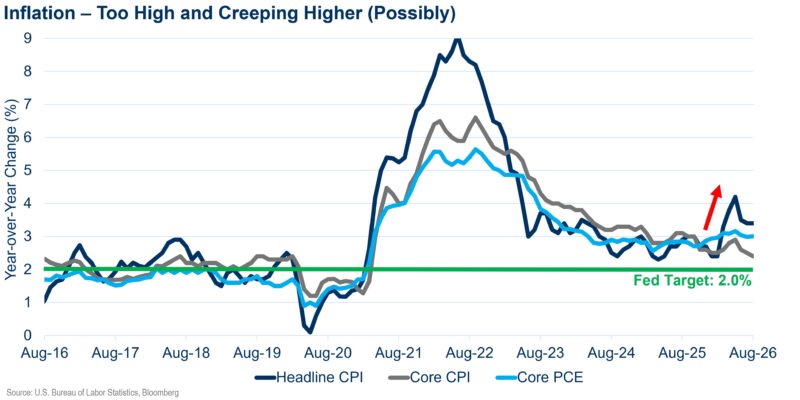
- Core CPI and PCE remain stubbornly elevated – near 3.0%, well above the Fed’s 2.0% target. Recent monthly data are indicating that inflation may be set to taper off.
- However, Inflation could be stubborn above 3% due to higher energy prices. It will remain heavily reliant on the persistence of conflict in the Strait, and the duration of issues with gas/diesel refining.
- Higher inflation keeps pressure on the Fed to maintain higher interest rates.
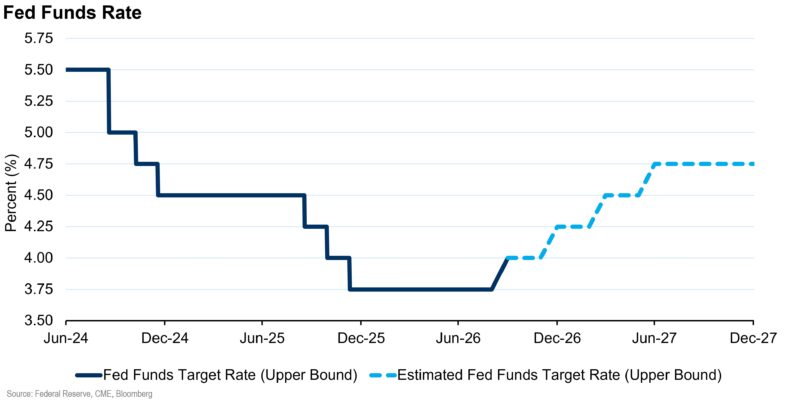
- The FOMC has initiated a “mild” tightening campaign, hoping to help bring inflation down to their target (closer to 2.00%)
- The Fed has pledged to bring Inflation under control, but they are estimating that they will only need to hike rates one or two more times during this cycle. This would represent an extremely mild tightening cycle, by historical comparisons.
- The Fed expects inflation to fall to a range below 2.5% next year, which seems to indicate that they believe the issues with oil and fuel prices will be resolved relatively soon.
- The futures market currently shows three more rate hikes before year end 2027.
Longer Rates Move Sharply Higher
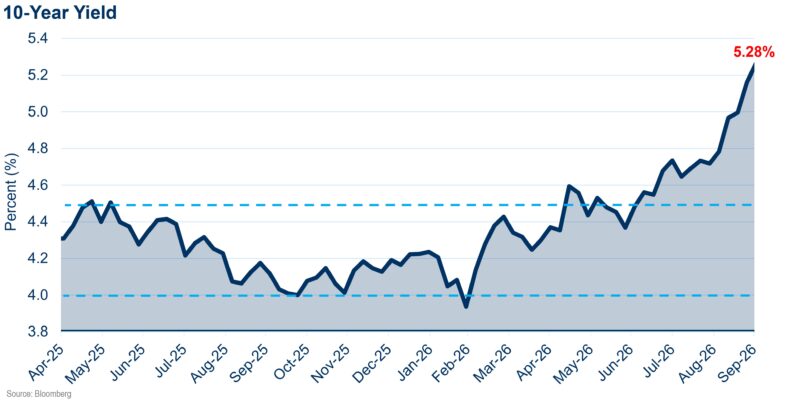
- The 10-year Treasury rate has spiked dramatically over recent months, establishing a 20-year high (roughly 5.30% at the time of this writing).
- Longer-term rates have pushed higher in response to the tightening campaign from the Fed, uncertainties around Inflation forecasts, and other challenges with geopolitics and persistent budget deficits.
- Despite initial concerns that the 5% barrier might represent a tipping point for the equity market, earnings growth helped the S&P 500 push to fresh all-time highs, shrugging off higher rates.
- Recent rate increases have drawn comparisons to the sharp spikes that occurred in the 1990s.
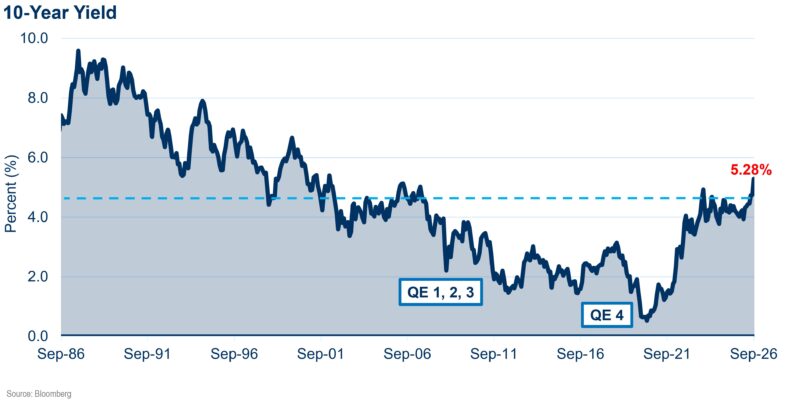
- A longer-term view illustrates that the recent rate increase, while dramatic, has merely pushed us back into the range that persisted before the age of Quantitative Easing.
- Comparisons to the 1990s are reasonable. There were three periods of sharp rate increases during that decade – moves that were more dramatic than those that have occurred over the last six months.
- Despite the dramatic shifts in rates in ‘93, ‘95 and ‘98, the economy and stock markets remained quite buoyant. (see next page)
- Today’s cycle has parallels with the 1990s. The economy is quite strong and earnings growth is robust. This has, thus far, helped both the economy and stock market continue to expand, despite serious upward moves in interest rates.
90s Repeat?
- The 1990s were a period of extremely healthy economic growth.
- Inflation was quite low in the mid-90s, but the Fed was concerned about the possibility of an overheating economy generating higher inflation. The Fed executed multiple hiking cycles during the decade.
- With much uncertainty about the direction for overnight rates, plus concerns over inflation, longer-term rates moved rapidly higher on three different occasions.
- Despite dramatic rate increases, the U.S. economy continued to expand at a very healthy rate. Powerful earnings growth helped support the stock market.
- During the first rate cycle (1993-1994) the stock market was flat.
- During the next two cycles (1995-1996 and 1998-1999), the stock market experienced dramatic expansion.
- The decade of the 1990s illustrated how a strong economy (and market) can withstand seemingly dramatic increases in interest rates.
- Our current cycle (2026) is starting with MUCH lower rates and is expected to end well short of the increases seen in the 1990s. The consensus forecast expects 10-year rates to peak very near current levels.
Crude Oil and Fuel Prices – an Ongoing Issue
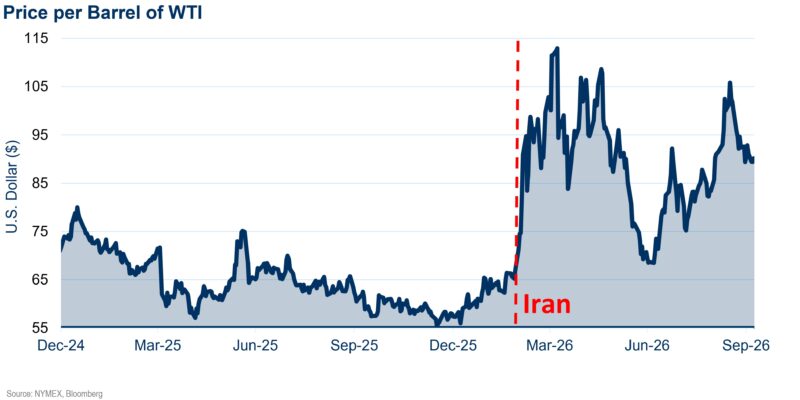
- WTI crude has continued on a volatile path, reacting to daily news regarding the conflict with Iran.
- Prices have subsided reasonably well from crisis peaks.
- The futures market shows oil grinding steadily lower over the next year, settling around $80/barrel.
- The markets continue to believe the crisis and supply of crude will be solved in a reasonable time frame.
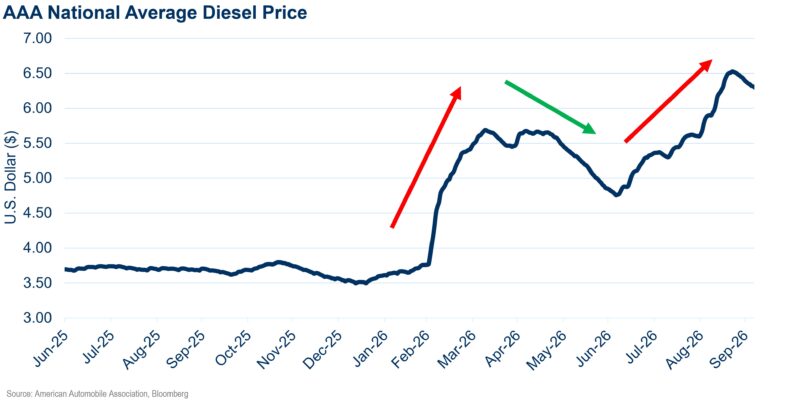
- Diesel fuel prices have remained at/near all-time highs, despite the steady increase of crude oil leaving the Middle East.
- Refining capacity is constrained in both the U.S. and Russia, severely limiting our ability to produce diesel fuel, regardless of the supply of crude oil.
- There is a risk that current historic prices for diesel will be passed through the supply chain soon, keeping a floor under inflation rates.
GDP Steady – Inside K-Shaped Economy
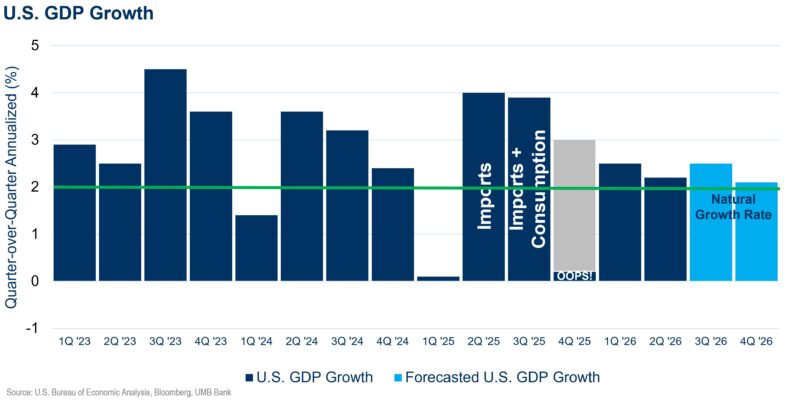
- Economic activity in the U.S. has proven quite resilient, despite the ongoing global turmoil.
- Consumption appears to be driven almost exclusively by high-income households. Lower income households appear to be under pressure, with rising credit card balances and rising default rates on consumer debt.
- Strong consumption, combined with heavy CapEx in the tech space (server farm buildout) has resulted in GDP growth that has held steady at our normal growth rate of 2.0%, despite a global oil shock, which historically would have resulted in “demand destruction.”
- GDP is expected to maintain at 2.0% or better through 2027.
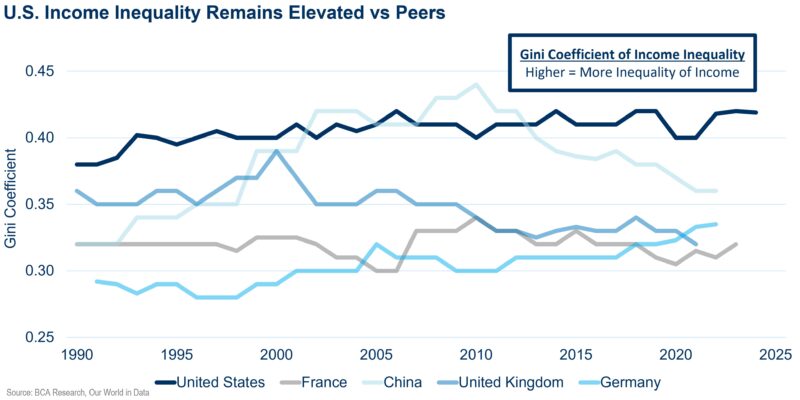
- The United States leads the developed world in a traditional measure of income inequality known as the Gini coefficient.
- For many decades, the U.S. has been a nation with higher levels of dispersion between the top and bottom households, in terms of both income and wealth.
- Income dispersion is to be expected in a free-market system that is as large, dynamic and competitive as the United States.
- Income inequality (the K-Shaped Economy) has become a social and political flash point in recent years.
- The only viable solution for reversing this trend is higher income tax rates and more aggressive re-distribution policies. This would begin to erode the foundation of the system’s dynamic, growth-focused orientation.
The K-Shaped Economy Should be Resilient if Market gets Volatile
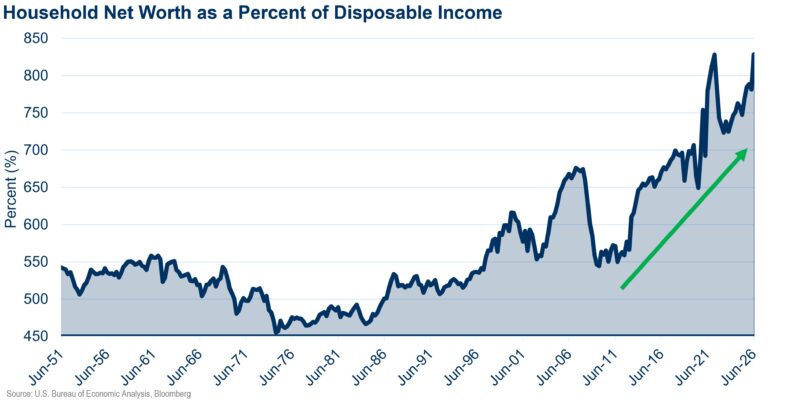
- Surging equity valuations from the AI Supercycle and rising home prices have pushed household net worth to a historic 800% of disposable income. The rise has been particularly pronounced over the last 15 years.
- This historic wealth accumulation acts as a critical psychological buffer, giving consumers the confidence to maintain spending patterns. A challenge: Nearly 90% of U.S. equity exposure is held by the wealthiest 10% of households (by income).
- By providing a financial safety net, this wealth expansion has allowed households—particularly high earners—to absorb higher costs at the pump, muting the impact of rising gas prices.
- While this wealth has stabilized the economy, it creates a high dependency on asset values. Any significant correction in the stock or housing markets could rapidly erode consumer confidence and destabilize broader spending levels.
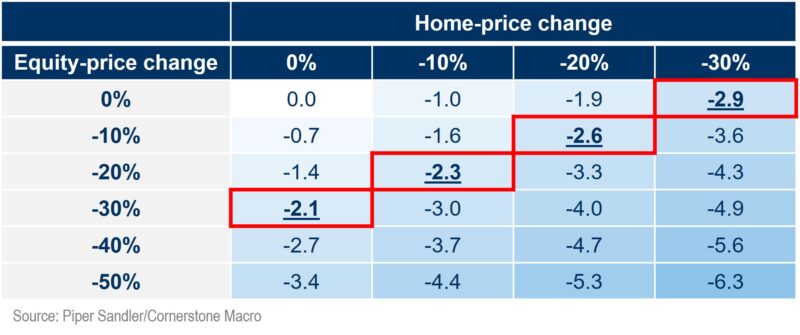
- Consumption has been driven in part by the massive run-up in wealth coming from the equity markets. There is concern amongst some academics that changes to household wealth (markets and homes) could rapidly erode consumption patterns.
- Consumer spending has been growing at a steady 2.5% pace for many years.
- Recent analysis estimates that equity markets or housing prices (or a combination of the two) could drop 30% before it would cause enough of a deterioration to turn negative.
Payrolls and Business Survey Look Strong
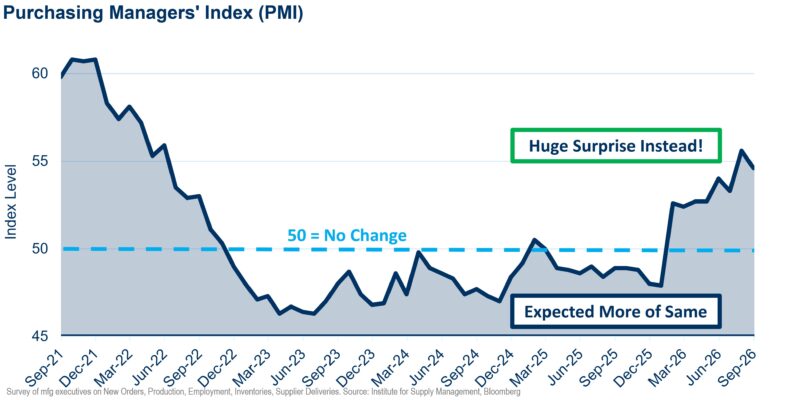
- The Manufacturing PMI has maintained a reading above the critical 50 threshold for over a year, marking a definitive turn away from its previous extended contractionary cycle.
- Direction matters and the continued positive trend higher is an encouraging sign that reinforces the underlying structural strength across the economy.
- The sustained factory momentum should drive industrial output and boost business confidence.
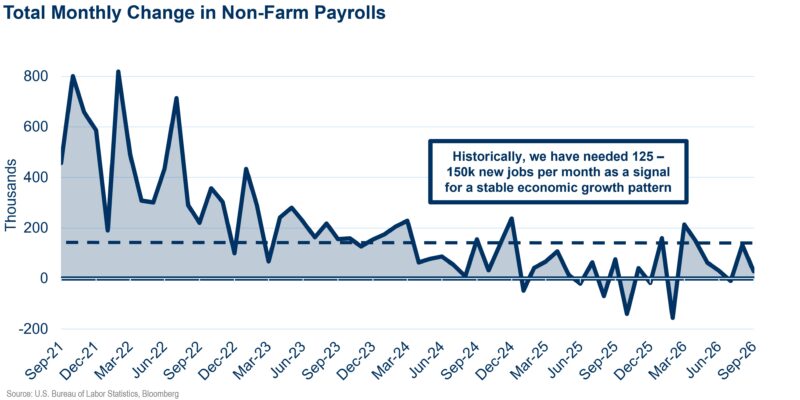
- Monthly job growth had been moving higher, closer to numbers that are historically more indicative of a steady economy (approximately 125,000 to 150,000 new jobs per month).
- While 125,000-150,000 has been the historical rule of thumb, slower immigration and labor-force growth has lowered the number of jobs needed to keep unemployment steady.
- While the new break-even estimates vary—anywhere from fewer than 10,000 jobs per month in a Federal Reserve Board analysis to about 68,000 on the Atlanta Fed’s calculator—the good news is that more modest gains in job growth may still signal economic stability.
Consumption Impacting Savings
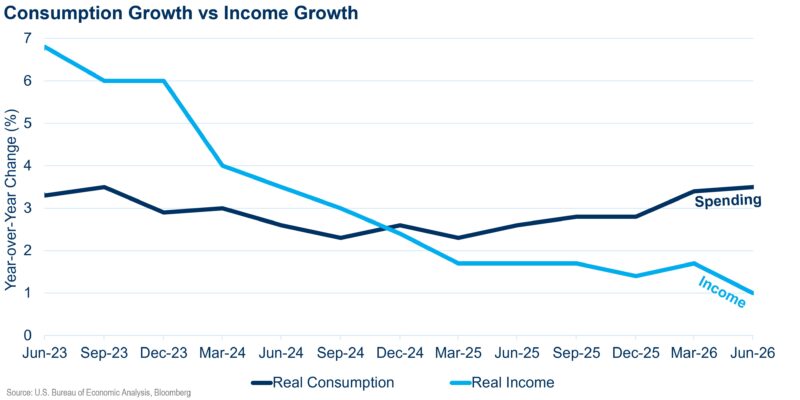
- Real consumption growth continues to rise while real income growth has slowed, widening the gap between spending and earnings.
- While spending outpacing income has supported demand and GDP growth, the divergence suggests households may be drawing on savings or credit to sustain consumption.
- If income does not catch up, the imbalance could become a headwind as borrowing capacity is exhausted or savings are depleted.
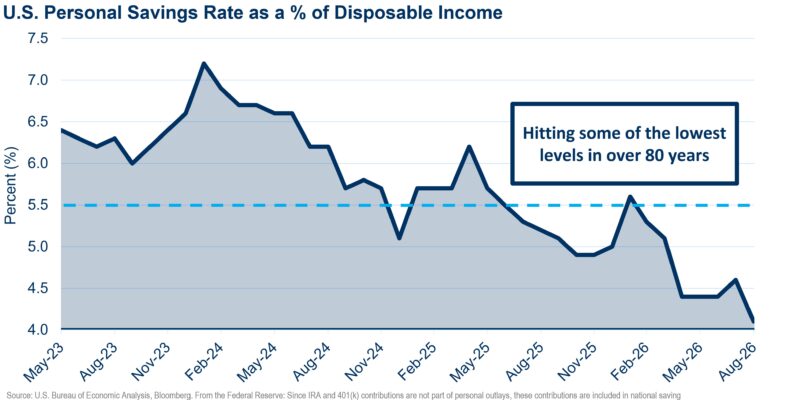
- The personal savings rate has fallen to some of the lowest rates we’ve seen in 80 years.
- A savings rate that low, alongside spending growth outpacing income, points to a thinner financial cushion for households.
- With less saved, consumers have less room to absorb higher costs or unexpected expenses, which could leave spending more vulnerable if conditions weaken.
Equities and Fed Tightening Cycles
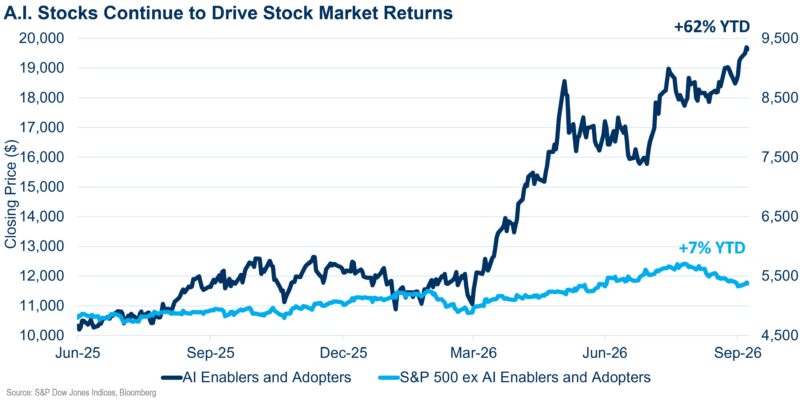
- AI remains the market’s main engine: AI enablers and adopters are up about 62% YTD through September, versus roughly 7% for the S&P 500 excluding AI.
- Market breadth had been improving for much of the year, but started to reverse in August, leaving market returns more dependent on AI leadership and making broader participation an important trend to watch.
- Even with that concentration risk, we think the AI cycle is still in its earlier innings: technology buildouts can play out over several years, and continued infrastructure investment leaves room for growth, though earnings and spending will need to keep backing up expectations.
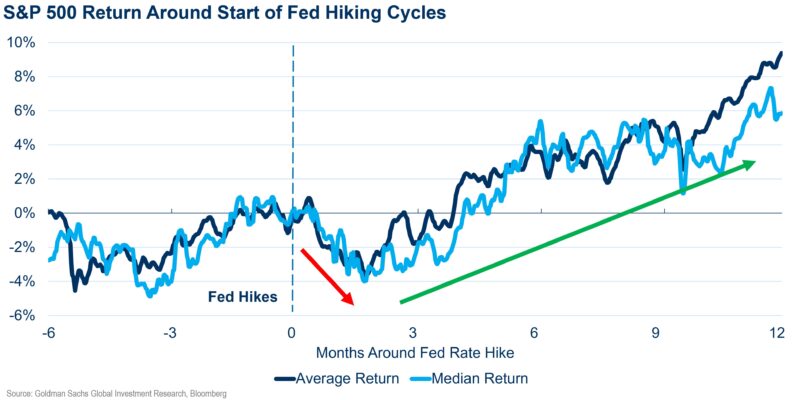
- A little weakness at the start of a new Fed hiking cycle isn’t unusual, but it tends to be short-lived—typically limited to the first two to three months. Even with that early softness, 12 months after the first hike the S&P 500’s average return has still been about 9% higher.
- The pace of hikes matters: back-to-back-meeting hikes (fast cycles) have typically been a tougher backdrop for stocks than a slower, more measured cycle. Twelve months after the first hike, the S&P 500 has averaged +10.5% during slow cycles versus -3.6% in fast cycles.
- The broader backdrop matters: when Fed hikes (or higher rates in general) come alongside a healthy economy and earnings, higher rates alone haven’t typically kept stocks from grinding higher.
U.S. Market Performance – Equity and Fixed Income
EQUITY MARKET PERFORMANCE – Q3 2026
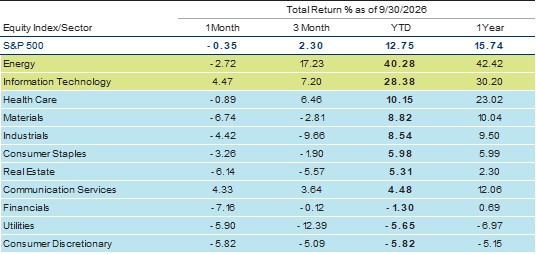
- The S&P 500 gained 2.30% while the Dow fell 2.70% and the Russell 2000 dropped 7.52%. The equal-weight S&P 500’s 2.23% decline showed the headline gains were driven by a rebound in mega-cap stocks rather than broad participation.
- Energy led sector returns at 17.23% as crude rebounded amid Middle East tensions and renewed supply concerns. Technology (+7.20%) and Health Care (+6.46%) also advanced, while the AI trade became more selective: continued demand for compute and data-center investment supported software and select mega-cap technology names.
- Only four of 11 sectors rose, with Utilities (-12.39%) and Industrials (-9.66%) the weakest. Higher yields and the Fed’s September rate hike were a more difficult backdrop for rate-sensitive and cyclical equities, helping explain why smaller companies and several economically sensitive sectors lagged.
BOND MARKET PERFORMANCE – Q3 2026
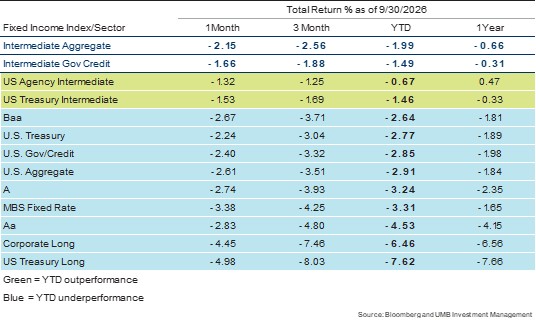
- The U.S. Aggregate Bond Index fell 3.51% as yields rose amid sticky inflation, energy risks, stronger growth and the Fed’s 25-basis-point September hike.
- Duration was a key headwind: the 2-year yield rose 73 basis points—the largest quarterly increase since Q2 2023—while 10- and 30-year yields reached their highest levels since 2002. Long Treasuries lost 8.03% and long corporates 7.46%, versus declines of 1.69% for intermediate Treasuries and 1.25% for intermediate agencies.
- Fiscal-issuance concerns and AI-related borrowing added pressure at the long end. Baa corporates fell 3.71% and fixed-rate MBS fell 4.25%, while intermediate agencies were a relative bright spot.
Follow UMB‡ on LinkedIn to stay informed of the latest economic trends.
When you click links marked with the “‡” symbol, you will leave UMB’s website and go to websites that are not controlled by or affiliated with UMB. We have provided these links for your convenience. However, we do not endorse or guarantee any products or services you may view on other sites. Other websites may not follow the same privacy policies and security procedures that UMB does, so please review their policies and procedures carefully.
DISCLOSURES AND IMPORTANT CONSIDERATIONS
This report is provided by UMB Trust & Investment Services a division of UMB Bank, n.a. for informational purposes only and contains no investment advice or recommendations to buy or sell any specific securities. Statements and projections in this report are based on the information provided by the client or third parties, and available as of the date this report was published. UMB Trust & Investment Services obtained information used in this report from third-party sources it believes to be reliable, but this information is not necessarily comprehensive, and UMB Trust & Investment Services does not guarantee that it is accurate. All investments involve risk, including the uncertainty of dividends, rates of return and yield and the possible loss of principal. Past performance is no guarantee of future results.
The S&P 500 Index is unmanaged, consisting of a market capitalization-weighted index of 500 common stocks. It is not possible to invest directly in an index.
You should not use this report as a substitute for your own judgment, and you should consult with professional advisors before making any tax, legal, financial planning or investment decisions. This report contains no investment recommendations, and you should not interpret the statements in this report as investment, tax, legal, or financial planning advice.
Neither UMB Trust & Investment Services nor its affiliates, directors, officers, employees or agents accepts any liability for any loss or damage arising out of your use of all or any part of this report.
“UMB” — Reg. U.S. Pat. & Tm. Off. Copyright © 2026. UMB Financial Corporation. All Rights Reserved
Securities offered through UMB Private Wealth Management, LLC (UMBPWM), an SEC registered investment adviser, UMB Financial Services, Inc. (UMBFSI), member FINRA, SIPC, a broker dealer and SEC registered investment adviser, UMB Trust & Investment Services, a division within UMB Bank, n.a., and UMB Bank, n.a. Capital Markets Division, a separately identifiable division of UMB Bank, n.a. and an SEC registered municipal securities dealer.
Banking services offered through UMB Bank, n.a.
Insurance products offered through UMB Insurance, Inc., a subsidiary of UMB Bank.
UMBPWM, UMBFSI and UMB Bank are affiliates and wholly owned subsidiaries of UMB Financial Corporation.
You may not have an account with all of these entities. Contact your UMB representative if you have any questions.