Last year around this time, I wrote an article that discussed reviewing and testing the assumptions used in bank interest rate risk management models. The purpose of that article was to encourage readers to rethink and retool their models in anticipation of changes in market interest rates and changes in the economy.
Well, as Bob Dylan wrote: “The times, they are a-changin’”. The Federal Open Market Committee (FOMC) is tightening monetary policy as economic growth and inflation are on the rise. Market interest rates have shot up over the past year and that is having a significant impact on community banks.
The changing times
Before we review the model’s performance, let’s first review what happened in the economy over that time period.
Gross domestic product (GDP) increased by +3.50% from the first quarter of 2021 to the first quarter of 2022. The GDP Price index increased +8.1% while Core Personal Consumption Expenditures (PCE, the FOMC’s preferred measure of price inflation) increased by +5.1%.
Since the end of March 2021, the Fed Funds Target Rate has increased by 75 basis points (bps), the yield on the two-year treasury note has increased by more than 233 bps and the yield on the 10-year treasury note has increased by more than 101 bps.
In addition to increasing short-term interest rates, the FOMC is in the process of shrinking its balance sheet and reducing liquidity. The market anticipates that the FOMC will increase the Fed Funds Target Rate to a range of 2.50% to 2.75% by the end of 2022.
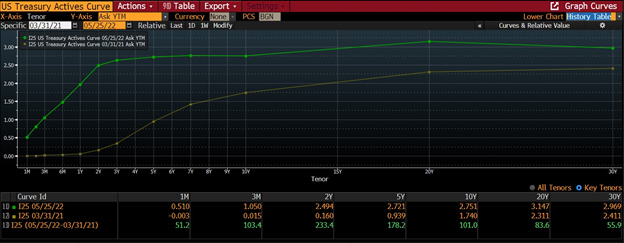
Source: Bloomberg, 2022
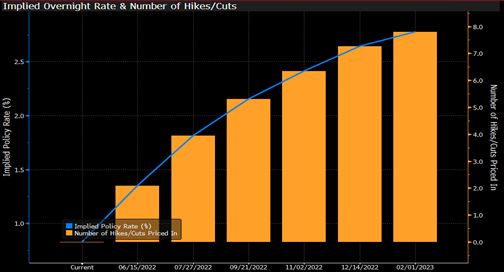
Source: Bloomberg, 2022
Changing bank balance sheets
As market interest rates have changed, so have bank balance sheets. Deposit growth has slowed while loan growth has accelerated. Growth in the investment portfolio has increased as banks deployed excess cash into securities through the end of the first quarter of 2022.
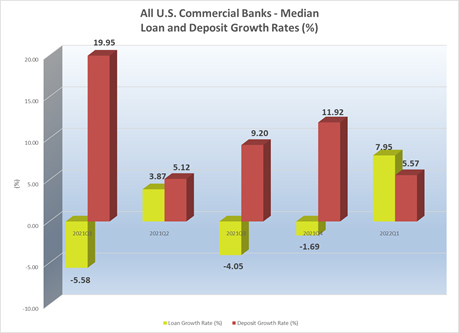
Source: S&P Global Intelligence, Cap IQ Pro, 2022
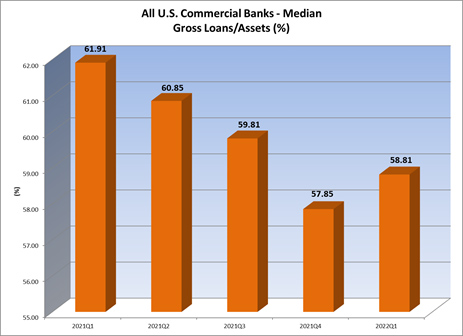
Source: S&P Global Intelligence, Cap IQ Pro, 2022
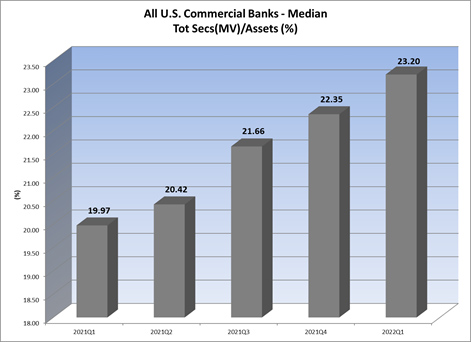
Source: S&P Global Intelligence, Cap IQ Pro, 2022
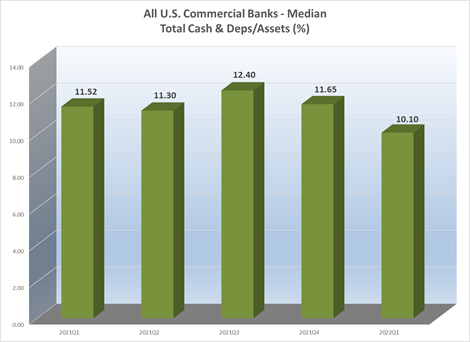
Source: S&P Global Intelligence, Cap IQ Pro, 2022
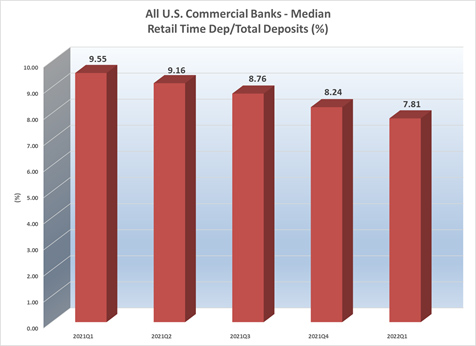
On the liability side of the balance sheet, non-interest-bearing, non-maturity deposits occupy a greater proportion of total funding as retail time deposit balances continue to decline.
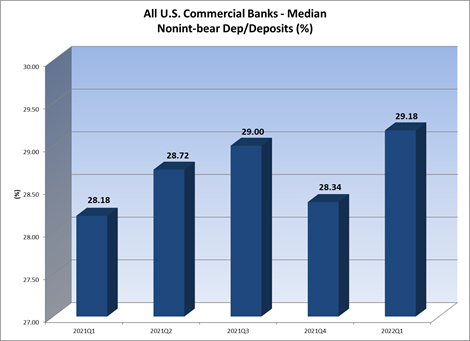
Source: S&P Global Intelligence, Cap IQ Pro, 2022
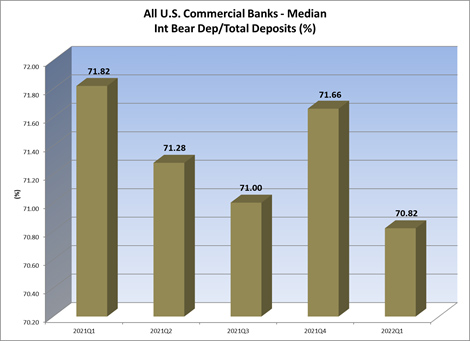
Source: S&P Global Intelligence, Cap IQ Pro, 2022
Source: S&P Global Intelligence, Cap IQ Pro, 2022
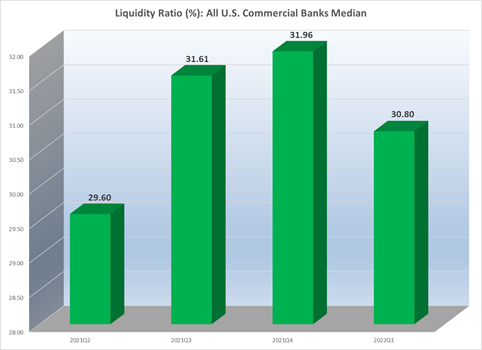
Liquidity remains relatively high for most U.S. commercial banks, but that liquidity is starting to decline.
Source: S&P Global Intelligence, Cap IQ Pro, 2022
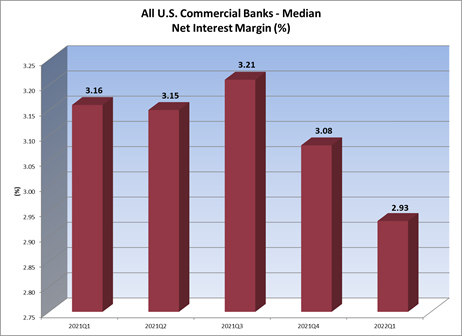
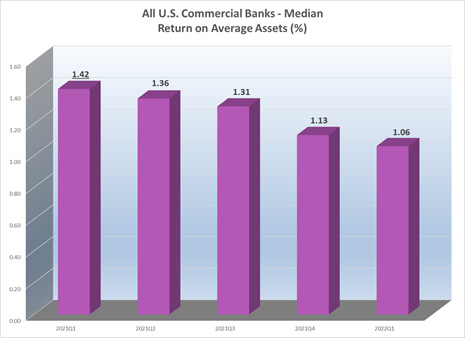
Bank profitablity continued to suffer through the end of first quarter of 2022 despite the increase in market interest rates and the shift in asset/liability mix.
Source: S&P Global Intelligence, Cap IQ Pro, 2022
Source: S&P Global Intelligence, Cap IQ Pro, 2022
Back testing model estimates
The first step in evaluating the accuracy of an interest rate risk measurement model is to conduct a back test. I compared the 12-month model projections for interest income and interest expense from the March 2021 model to the actual annualized interest income and interest expense experienced by my sample bank as of March 2022.
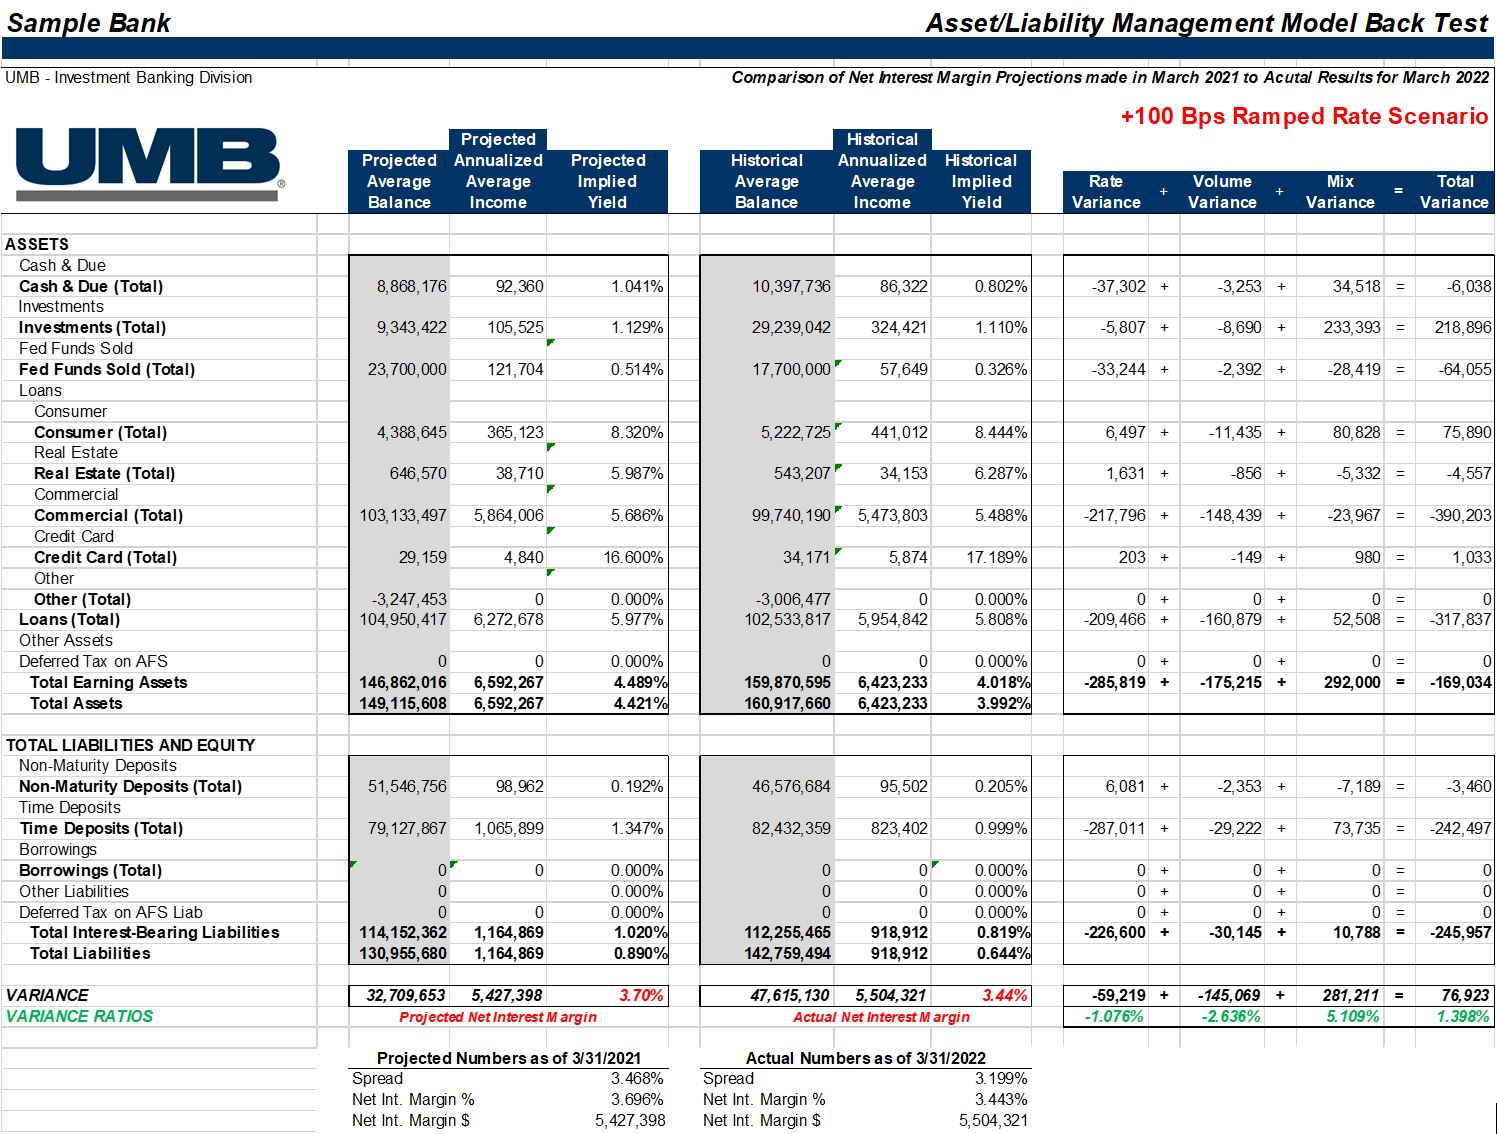
Between March 2021 and March 2022, short-term market interest rates increased, on average, by 99 bps and long-term market interest rates increased, on average, by 130 bps. I then used the 12-month projections from the +100 bps ramped rate scenario for comparison purposes. The Net interest income variance analysis results are shown below.
Source: UMB Internal data, 2022
In general, this bank’s model performed fairly well. The total net interest income variance was $76,923 or +1.4% (actual net interest income exceeded the 12-month projected net interest income estimate by $7,923). The model overestimated interest income by $165,034 and overestimated interest expense by $245,957. Since the model assumed a static balance sheet, I am less concerned with the volume and mix variance and focus more on the rate variance.
If rates from March 2021 increased by +100 bps in a gradual, parallel fashion, the model projected that the implied yield on loans would be 5.98% by March 2022. The actual implied yield on loans in March 2022 was 5.81%. Thus, the model overestimated the repricing rates on loans.
Since the largest proportion of loans are held in the commercial loans account, I suggested the bank alter the repricing betas and repricing margins (spreads) assumptions on that account to reflect its current practice. Competition in the commercial loan market in the bank’s region is causing the bank to price new loans with lower margins.
Similar adjustments were made on the liability side of the balance sheet. If rates from March 2021 increased by +100 bps in a gradual, parallel fashion, the model projected that the implied yield on time deposits would be 1.35% by March 2022. The actual implied yield on March 2022 was 1.00%. Thus, the model overestimated the repricing rates on time deposits.
I suggested the bank alter the repricing betas and repricing margins (spreads) on that account to reflect the current pricing practice. The bank has traditionally relied upon time deposits as its primary source of funding but has realized it does not need to be as aggressive in pricing. The bank does not anticipate the need to be more aggressive in time deposit pricing for the next 12 months.
The model was very accurate in repricing non-maturity deposits. The model projected that the implied yield on interest-bearing non-maturity deposits would be 0.192% by March 2022 and the actual yield was 0.205%. I concluded from those results that the assumptions on interest-bearing non-maturity deposit accounts were set properly.
Back testing loan prepayment assumptions
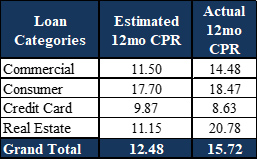
In addition to the net interest income variance analysis, I also ran a loan prepayment analysis to see how the prepayment rates estimated by the interest rate model compared to the actual prepayment rates incurred by the bank from March 2021 to March 2022. The results are presented in the chart below.
Source: UMB Internal data, 2022
The model underestimated principal prepayments on all loan categories except credit cards. The bank experienced a higher level of loan refinancing than originally anticipated from March 2021 to March 2022, but opted to not change the loan prepayment assumptions in the model.
The bank believes that, in the wake of a rapid increase in short-term interest rates, the incentive to refinance outstanding loans has diminished and that model estimates may be more in-line with reality going forward.
Stress testing
Now that the back tests are completed and the model assumptions adjusted, it is time to stress test those assumptions. We have received numerous requests for key assumption stress tests from clients that were either in the midst of a bank exam or were about to be examined. The purpose of the stress test is to determine how sensitive model estimates are to changes in key model assumptions, particularly assumptions related to non-maturity deposit accounts and loan prepayments.
Essentially, we are asking, “what if we are wrong about our assumptions?” What happens to the bank’s interest risk profile if we make minor (or major) changes to key assumptions? In lieu of the changes in the balance sheet and market interest rates since the end of the first quarter of 2022, my client opted to wait until the end of the second quarter of 2022 to run assumption stress tests.
Modeling bank interest rate risk is a dynamic process. The ever-changing economic and regulatory landscape make measuring interest risk a challenge, particularly when those landscapes experience seismic shifts.
As we have shown, rapid changes in market environments can challenge the accuracy of interest rate risk models. By using tools and resources like our loan prepayment calculator and advanced core deposit study, we can establish and enhance key interest rate risk model assumptions and address the interest rate risk measurement needs of our clients in any environment.
Learn how UMB Bank Capital Markets Division’s fixed income sales and trading solutions can support your bank or organization, or contact us to be connected with a team member.


