In June 2020, my colleague, Katie Shands, wrote a blog article about community bank balance sheet stress testing. At that time, the country was in the third month of the COVID-19 shutdown and there was great concern that the economy would enter a recession. Financial regulators were concerned that bank loan portfolios would be adversely impacted by a prolonged economic slowdown and strongly encouraged banks to conduct stress tests and devise plans to deal with this possibility.
The economy is in a very different place now compared to where it was in June 2020. Then, the FOMC (Federal Open Market Committee) was drastically cutting the federal funds target rate and pouring trillions of dollars into the economy to insulate it from the impact of the COVID-19 shutdown. In 2022 and 2023, the FOMC increased the federal funds target rate by 500 bps and is now removing large sums of dollars from the money supply. From April 2022 to March 2023, the M2 money supply decreased by $924 billion.

Source: FRED Economic Data, Federal Reserve Bank of St. Louis, 2023.

Source: FRED Economic Data, Federal Reserve Bank of St. Louis, 2023.
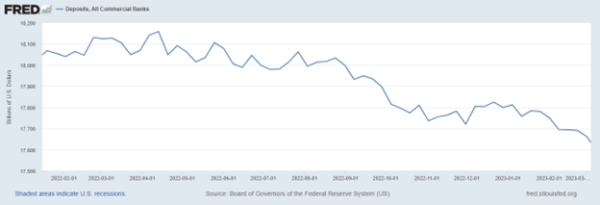
By the end of 2020, banks were flush with deposits and excess liquidity. In 2023, with fewer dollars in the economy and higher interest rates, bank deposits declined, and liquidity has been greatly reduced. From April 2022 to March 2023, deposits at commercial banks declined by $496 billion.

Source: FRED Economic Data, Federal Reserve Bank of St. Louis, 2023.
Source: FRED Economic Data, Federal Reserve Bank of St. Louis, 2023.
While banks were flush with liquidity in 2020 and 2021, demand for loans was stagnant so many banks invested their excess liquidity into fixed-income securities. These securities were purchased when market rates were at record lows. With the rapid increase in the federal funds target rate from March 2022, market interest rates have risen significantly causing the value of fixed-income securities purchased in 2020 and 2021 to decline significantly. This rapid devaluation of bank investment portfolios has exacerbated liquidity issues. Significant unrealized losses in market value have reduced the amount of viable collateral for borrowing or pledging to deposits.
These stresses, in conjunction with the failures of Silicon Valley Bank, Signature Bank and First Republic Bank, have heightened the concern for bank safety and soundness. In recent months, financial regulators have expressed growing concern with valuation in the commercial real estate market and the impact that it can have on regional and community banks. According to a recent article from J. P. Morgan Wealth Management, regional and community banks have over 4 times more exposure to commercial real estate loans than the larger, money-center banks. The authors go on to state: “Within that cohort of small banks, CRE (Commercial Real Estate) loans make up 28.7% of assets, compared with only 6.5% at big banks. More worrying, a significant percentage of those loans will require refinancing in the coming years, exacerbating difficulties for borrowers in a rising rate environment.”[1] Financial regulators are strongly encouraging regional and community banks to conduct stress tests and develop actionable plans to mitigate these risks.
Developing meaningful loan portfolio stress tests
Stress testing is a process that evaluates the potential impact of adverse economic scenarios on a financial institution’s portfolio. This testing enables community banks to assess the risks in their portfolios and make informed decisions about managing those risks.
Here are the key steps to follow when stress testing your CRE loan portfolio:
- Define the scope of the stress test. This includes identifying the economic scenarios that will be used to evaluate the portfolio, the time frame over which the stress test will be conducted, and the specific CRE loans that will be included in the test.
- Identify potential economic scenarios that could impact your CRE loan portfolio. These scenarios should be based on historical data and take into account potential changes in interest rates, vacancy rates, and other economic indicators.
- Determine the impact on loan performance. This includes assessing the likelihood of defaults, prepayments, and other adverse events.
- Estimate the potential loss to the portfolio. This can be done by applying loss-given-default (LGD) and probability-of-default (PD) models to the loan portfolio.
- Analyze the results. This includes assessing the impact on the bank’s capital adequacy, liquidity, and profitability. Based on the results of the stress test, the bank can make informed decisions about managing the risks in its CRE loan portfolio.
- Develop action plans. Finally, based on the results of the stress test, the bank should take appropriate action to manage its CRE loan portfolio. This may include increasing capital reserves, adjusting loan underwriting standards, or reducing exposure to high-risk loans.
We recently constructed a pair of CRE loan portfolio stress tests for a client using the steps listed above. We created a Mild Recession scenario and a Severe Recession scenario to estimate potential declines and/or losses in the CRE loan portfolio. In the Mild Recession scenario, we looked at historical data from the 2020 recession to estimate loan deferrals, prepayments, refinancings, charge-offs and recoveries. We used estimates developed for the bank’s Current Expected Credit Loss (CECL) model as a guide. In the Severe Recession scenario, we looked at historical data from the 2007-2009 recession to again estimate loan deferrals, prepayments, refinancings, charge-offs and recoveries. In both scenarios, we simulated a large, rapid decline in the Fed Funds Target rate and market interest rates in general. (Note: one of the inherent problems with using historical data as a guide is that it assumes that future conditions will match past conditions. While we recommend using historical data as a reference, we also recommend altering your model assumptions to accommodate changes in the balance sheet since the last recession or changes to the balance sheet that you anticipate occurring in the near future).
The mild recession simulation
During the recession of 2020, non-current loans as a percentage of total loans peaked at 0.22%. Non-current CRE as a percentage of total loans peaked at 0.38%. Net charge-offs on all loans peaked at 0.64%. Net charge-offs on CRE loans peaked at 0.03%. By the end of 2020, loan balances had grown by 11% but deposit balances had grown by 32%. For the Mild Recession stress test, we incorporated current conditions for loan and deposit growth. To address the stresses in the test, we used the bank’s Contingency Funding Plan as a guide. The assumptions for the Mild Recession stress test are as follows:
- CRE loans equivalent to 1% of total loans become non-current loans over a 12-month period
- 10% of real estate construction loans become non-current loans over a 12-month period
- Allowance for loan losses and provision for loan losses increased in proportion to additional non-current loans
- Recession scenario market interest rates
- Loan prepayments increase by 20%
- Loan balances of all other loans held static (no growth). Loans are replaced as they mature or are refinanced
- Investment portfolio balances are maintained at current levels. Securities are replaced as they mature or are called
- Non-maturity deposit balances decline by -10% over a 12-month period
- Declining rate NMD betas reduced by half, lag period doubled
- Time deposit balances maintained at current levels. Declining rate time deposit beta reduced by half, no lag
- Fed fund sold and due from bank balances used for immediate liquidity needs
- Overnight borrowings from FHLB used for additional liquidity needs
The recession rate scenario projected the federal funds target rate to be in a range of 4.50% to 4.75% at the end of 12 months and the yield curve would flatten slightly.
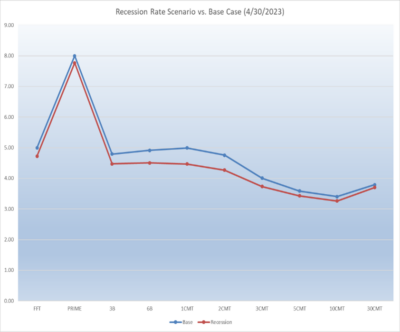
Source: UMB Bank, Capital Markets Division, Financial Services Group, 2023
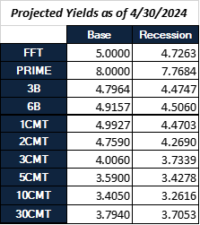
Source: UMB Bank, Capital Markets Division, Financial Services Group, 2023
The table below compares the Net Interest Income (NII) and Net Interest Margin (NIM) estimates from the bank’s static balance sheet simulation to the NII and NIM estimates generated by the Mild Recession scenario.

Source: UMB Bank, Capital Markets Division, Financial Services Group, 2023
The results demonstrate that the Mild Recession scenario would reduce the 12-month projected NII by approximately -$1.5 million, NIM would be reduced by approximately -14 bps and Net Income would be reduced by approximately -$1.6 million from the estimates generated in the 12-month Static Balance sheet simulation. The scenario required the bank to borrow overnight funds, but borrowings never exceed 10% of total liabilities.
To mitigate the estimated decline in NII and NIM in the Mild Recession scenario, we altered the reinvestment assumptions on the investment portfolio. The revised simulation maintained the balances in Agencies and U.S. Treasuries (in order to maintain sufficient collateral for pledging) but allowed the balances in Municipal securities to runoff into Fed Funds Sold. The results are displayed in the table below.

Source: UMB Bank, Capital Markets Division, Financial Services Group, 2023
Allowing maturing and called balances in municipal securities to roll off into Fed Funds Sold did not have a significant impact on the 12-month analysis. Upon further review of the expected cash flows in municipal securities beyond 12 months, the bank decided that it was still a prudent step to mitigating the impact of a Mild Recession on earnings and therefore included this action item in its Contingency Funding Plan.
To gauge the impact of the Mild Recession on capital, we used a 12-month Forward Economic Value of Equity estimation for the Recession scenario. The 12-month Forward Economic Value of Equity estimation is made as of 4/30/2024, the end of the simulation period, after all assumed changes to the balance sheet and interest rates have taken place. These results are contained in the table below.

Source: UMB Bank, Capital Markets Division, Financial Services Group, 2023
The table above shows that the 12-Month Forward EVE (Economic Value of Equity) in the Recession scenario was -$11.3 million less than the 12-Month Forward EVE in the Static Balance Sheet scenario (a decrease of -5.6%) and the 12-Month Forward Leverage Ratio in the Recession scenario was -73 bps less than the 12-Month Forward Leverage Ratio in the Static Balance Sheet scenario. While the Recession scenario had a significant impact on the value of the bank’s capital, the bank remained well-capitalized.
When the assumptions allowed for maturing and called balances in Municipal securities to roll off into Fed Funds Sold, the 12-Month Forward Economic Value of Equity changed to the following:

Source: UMB Bank, Capital Markets Division, Financial Services Group, 2023
Allowing for maturing and called balances in municipal securities to roll off into Fed Funds Sold had a minor impact on the 12-Month Forward EVE in the Recession scenario. The 12-Month Forward EVE estimate in this Recession scenario was -5.7% less than the 12-Month Forward EVE in the Static Balance Sheet scenario.
What we learned from this stress test is that, while the bank will earn LESS income if a mild recession occurs over the next 12 months, it is not LOSING income. We also learned that, while the value of the bank’s equity will be negatively impacted by a Mild Recession, the bank remained well-capitalized (Note: the decline in market interest rates led to a significant improvement in the bank’s Unrealized Loss on AFS securities which partially offset the reduction in the value of bank equity). We learned that the Contingency Funding Plan performed well in a simulated environment and no changes to the plan were required.
The severe recession simulation
During the recession of 2007-2009, non-current loans as a percentage of total loans for our sample bank peaked at 1.82%. Non-current CRE as a percentage of total loans peaked at 2.14%. Net charge-offs on all loans peaked at 2.24%. Net charge-offs on CRE loans peaked at 1.92%. By the end of 2009, loan balances had declined by -5% and deposit balances had shrunk by 5%. For the Severe Recession stress test, we incorporated more aggressive declines in loan and deposit balances. Like the Mild Recession stress test, we used the bank’s Contingency Funding Plan to address the stresses in the test. The assumptions for the Severe Recession stress test are as follows:
- 15% of CRE loans become non-current loans over a 24-month period
- 30% of real estate construction loans become non-current loans over a 12-month period
- Allowance for loan losses and provision for loan losses increased in proportion to additional non-current loans
- Recession scenario market interest rates
- Loan prepayments increase by 20%
- Loan balances of all other loans held static (no growth). Loans are replaced as they mature or are refinanced
- Declining rate loan betas increased from 1.0 to 1.25
- Investment portfolio balances in US Agency and US Treasury securities are maintained at a level sufficient for pledging and to provide collateral for borrowing. Cash flows from municipal and MBS securities will not be reinvested.
- Non-maturity deposit balances declined by -15% over a 24-month period
- Declining rate NMD betas reduced by half, lag period doubled
- Time deposit balances maintained at current levels. Declining rate time deposit beta reduced by half, no lag
- Fed Fund Sold and due from bank balances used for immediate liquidity needs
- Overnight borrowings from FHLB used for liquidity needs over the first 3 months
- After 3 months, overnight borrowings will be replaced by term advances from FHLB
- FHLB term advances will be limited to 50% of the current available allowance
- If liquidity needs cannot be met through FHLB term advances, municipal securities will be sold, and brokered CDs will be issued at above-market rates to provide additional funding.
The tables below compare the Net Interest Income (NII) and Net Interest Margin (NIM) estimates from the bank’s static balance sheet simulation to the NII and NIM estimates generated by the Severe Recession scenario.

Source: UMB Bank, Capital Markets Division, Financial Services Group, 2023

Source: UMB Bank, Capital Markets Division, Financial Services Group, 2023
The results demonstrate that, the Severe Recession scenario would reduce the 12-month projected NII by approximately -$1.6 million, NIM would be reduced by approximately -15 bps and Net Income would be reduced by approximately -$2.9 million from the 12-month Static Balance Sheet simulation. In the 24-month simulation, projected NII declines by approximately -$6.175 million, NIM would be reduced by approximately -52 bps and Net Income would be reduced by approximately -$7.5 million from the estimates generated in the 24-month Static Balance Sheet simulation. Borrowings hit the cap on FHLB Advances in month 7 of the simulation. Liquidity needs after month 7 were fulfilled with the issuance of 12 Month Brokered CDs and the sale of longer-term Municipal securities.
The impact of the Severe Recession scenario on capital was also significant. The 12-Month and 24-Month Forward EVE reports are shown below.

Source: UMB Bank, Capital Markets Division, Financial Services Group, 2023

Source: UMB Bank, Capital Markets Division, Financial Services Group, 2023
The 12-Month Forward EVE estimate in the Severe Recession scenario was more than -$15 million below the Static Balance Sheet simulation 12-Month Forward EVE estimate (a reduction of -7.7%). The 24-Month Forward EVE estimate in the Severe Recession scenario as more than -$29 million below the Static Balance Sheet simulation 24-Month Forward EVE estimate (a reduction of -12.9%). The 12-Month Forward Leverage Ratio estimate in the Severe Recession scenario was more than -98 bps below the Static Balance Sheet simulation 12-Month Forward Leverage Ratio estimate. The 24-Month Forward Leverage Ratio estimate in the Severe Recession scenario was more than +99 bps above the Static Balance Sheet simulation 24-Month Forward Leverage Ratio estimate. The increase in the 24-Month Forward Leverage Ratio in the Severe Recession scenario over the Static Balance Sheet Leverage Ratio was due to the decrease in the fair value of the assets being larger than the decrease in the fair value of liabilities.
To complete the Severe Recession stress test, we modeled the impact of Non-Current Loans becoming Charge-offs. In months 25-36 of the simulation, we converted 20% of Non-Current Loans into Charge-offs. That assumption reduced Net Income by over -28% but Net Income was still positive at the end of 36 months. The 36-Month Forward EVE estimate was reduced by -18% but the 36-Month Forward Leverage Ratio remained above 12%.
The Mild and Severe Recession stress test results demonstrate that, while bank profitability would be greatly impacted by a major decline in the economy, the steps taken in the bank’s Contingency Funding Plan would be sufficient to keep the bank adequately capitalized and remain profitable.
In summary, stress testing is an essential tool for community banks that want to manage their CRE loan portfolios effectively. By conducting stress tests regularly, banks can identify potential risks and take action to minimize their impact on the portfolio. By doing so, community banks can better position themselves to weather economic downturns and continue serving their customers’ needs.
[1] “Are banks vulnerable to a crisis in commercial real estate?”; By Joe Seydl, Jay Serpe and Ryan Asato; J.P. Morgan Wealth Management; April 12, 2023; https://www.jpmorgan.com/wealth-management/wealth-partners/insights/are-banks-vulnerable-to-a-crisis-in-commercial-real-estate‡
Learn how UMB Bank Capital Markets Division’s fixed income sales and trading solutions can support your bank or organization, or contact us to be connected with a team member.
When you click links marked with the “‡” symbol, you will leave UMB’s website and go to websites that are not controlled by or affiliated with UMB. We have provided these links for your convenience. However, we do not endorse or guarantee any products or services you may view on other sites. Other websites may not follow the same privacy policies and security procedures that UMB does, so please review their policies and procedures carefully.
Disclosure
This communication is provided for informational purposes only. UMB Bank, n.a. and UMB Financial Corporation are not liable for any errors, omissions, or misstatements. This is not an offer or solicitation for the purchase or sale of any financial instrument, nor a solicitation to participate in any trading strategy, nor an official confirmation of any transaction. The information is believed to be reliable, but we do not warrant its completeness or accuracy. Past performance is no indication of future results. The numbers cited are for illustrative purposes only. UMB Financial Corporation, its affiliates, and its employees are not in the business of providing tax or legal advice. Any materials or tax‐related statements are not intended or written to be used, and cannot be used or relied upon, by any such taxpayer for the purpose of avoiding tax penalties. Any such taxpayer should seek advice based on the taxpayer’s particular circumstances from an independent tax advisor. The opinions expressed herein are those of the author and do not necessarily represent the opinions of UMB Bank or UMB Financial Corporation.
Products, Services and Securities offered through UMB Bank, n.a. Capital Markets Division are:
NOT FDIC INSURED | MAY LOSE VALUE | NOT BANK GUARANTEED