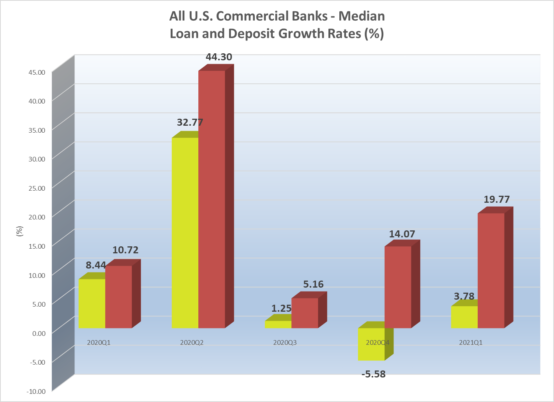
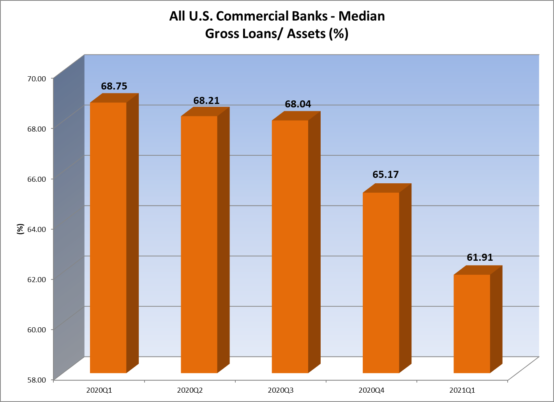
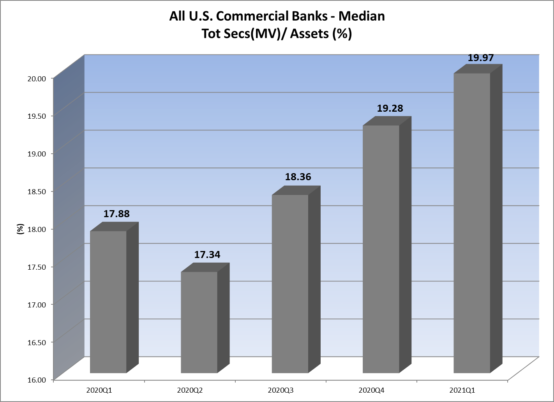
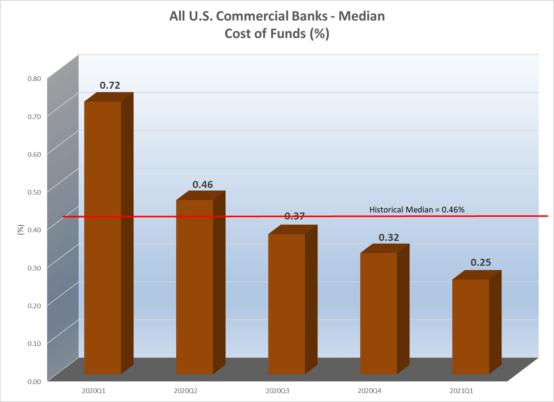
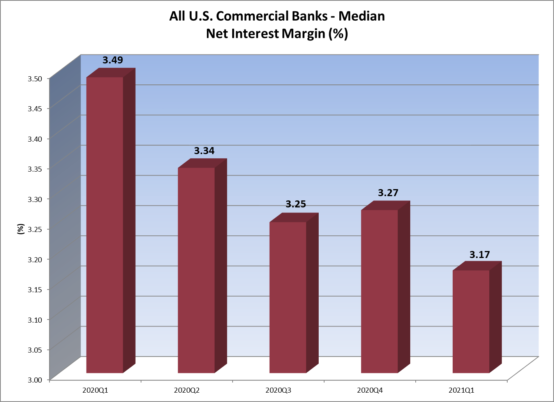
The precipitous decline in market interest rates that followed led to notable changes in community bank balance sheets. Two rounds of fiscal stimulus led to significant increases in deposits while loan demand fizzled (with the exception of SBA PPP loans, of course). Lack of loan demand then led to an increase in cash and investment portfolio balances. While community banks were quick to cut their deposit rates, the decline in assets yields outpaced the decline the cost of funds which led to a deterioration in Net Interest Margins.
Source: S&P Global Market Intelligence, 2021.
Source: S&P Global Market Intelligence, 2021.
Source: S&P Global Market Intelligence, 2021.
Source: S&P Global Market Intelligence, 2021.
Source: S&P Global Market Intelligence, 2021.
These changes produced some unique challenges to interest rate risk modeling. Over the past few months, we’ve worked with a number of clients to review and reevaluate their interest rate risk model assumptions. Back-testing conducted earlier this year revealed that, while a number of model assumptions performed well, others did not.
Our evaluations showed that loan and MBS prepayment assumptions as well as non-maturity deposit beta and lag assumptions were the most common sources of variance between projected net interest income and realized net interest income. In this quarter’s newsletter, we will demonstrate our procedures for reviewing and revising interest rate risk model assumptions related to loan prepayments and non-maturity deposit repricing.
Loan Prepayment Assumptions
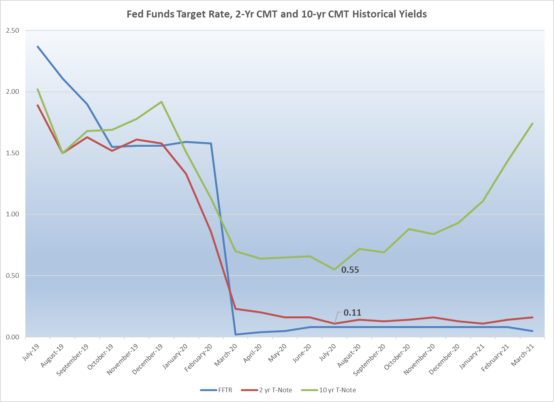
The FOMC started to cut the Fed Funds Target Rate (“FFTR”) in August 2019. At that time, the FFTR was reduced from a range of 2.25% to 2.50% to a range of 2.00% to 2.25%. The Prime Rate was then cut from 5.50% to 5.25%. The FOMC continued to cut the FFTR until November 2019, where it plateaued at a range of 1.50% to 1.75% (Prime Rate = 4.75%). The FFTR remained in that range until March 2020, where it was reduced to a range of 0.00% to 0.25% (Prime Rate = 3.25%). Over that time period, the yield on the 10-Year Constant Maturity Treasury declined from 1.98% to 0.55% in July 2020 while the yield on the 2-Year Constant Maturity Treasury declined from 1.81% to 0.11% in July 2020.
Source: Bloomberg, 2021.
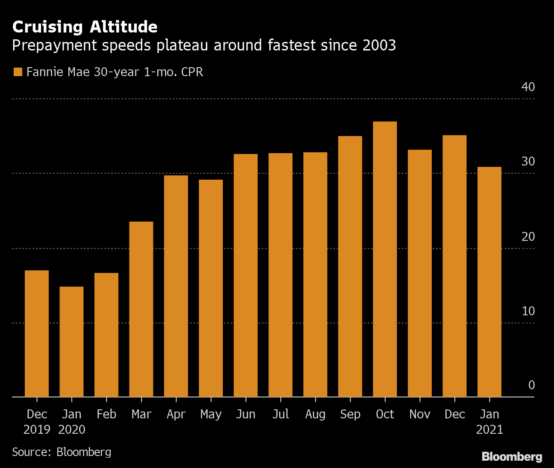
This large, unanticipated decline in market interest rates fueled a new round of mortgage refinancing. As the chart below demonstrates, prepayments on 30-year mortgages more than doubled from January 2020 to October 2020. This observation led us to consider how accurately our models captured this change in mortgage prepayments when estimated net interest income and Economic Value of Equity.
To test the accuracy of a model’s loan prepayment assumptions, we compared the 12-month CPR estimated by the model in March 2020 to the actual 12-month CPR recorded in March 2021. We used our Loan Prepayment Calculator to analyze all loans in the portfolio on March 31, 2020, estimating the principal balance (based on the underlying structure on the loan) at the end of the next 12 months (i.e., March 31, 2021), assuming no unscheduled payments of principal. The Loan Prepayment Calculator then compares that estimate to the loan’s actual principal balance recorded on March 31, 2021. If the March 31, 2021 actual balance is less than the March 31, 2020 estimated balance, we know that there were unscheduled principal payments during the past 12 months. The size of that difference is used to estimate the 12-month CPR. We then compare that 12-month CPR to the 12-month CPR projected by the model in March 2020.
The results of these back-tests were mixed. For some clients, actual prepayments exceeded projected prepayments over the past 12 months. For most of our clients, however, the model either over-estimated prepayments or its estimate was within an acceptable range of accuracy. For the clients whose back-test results showed the estimated loan repayments to be outside of an acceptable range, we calibrated the model prepayments assumptions to match the prepayment history experienced by the bank. This review and calibration will enhance the accuracy of the model estimates going forward.
Non-Maturity Deposits Rate Sensitivity Factors and Decay Rates
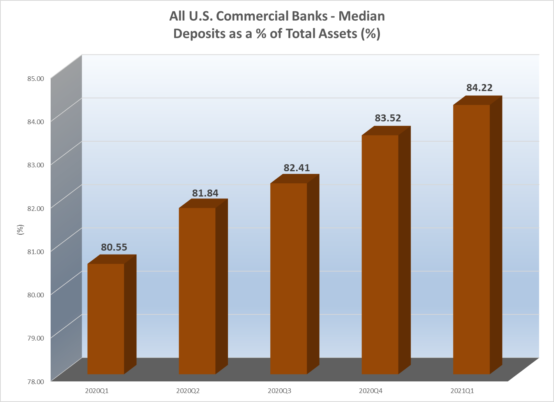
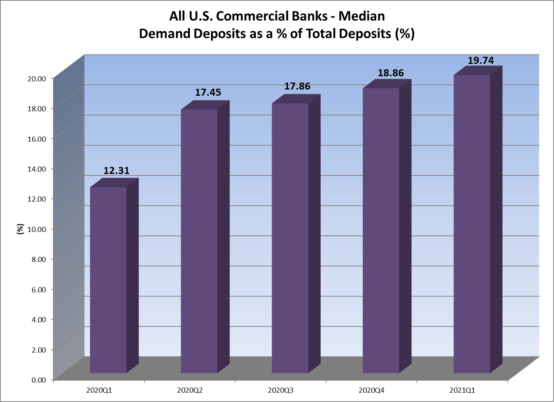
The significant decline in market interest rates, in conjunction with massive fiscal stimulus programs, led to more cash on bank balances sheets. While some of that excess cash came from bond calls and loan prepayments, most of it came from an influx of deposits. As the charts below demonstrate, bank balance sheet was flush with deposits by the end of the 1st quarter of 2021.
Source: S&P Global Market Intelligence, 2021.
Source: S&P Global Market Intelligence, 2021.
The decline in loan demand decreased the need for liquidity so banks were quick to cut deposit rates as market interest rates were dropping. As the Cost of Funds chart shown previously demonstrated, commercial bank reduced deposit rate by over 50 bps over the course of 2020. This evidence prompted us to review the Non-Maturity Deposit (“NMD”) beta and decay rate assumptions in our models, particularly the betas and decay rate assumptions used in declining market interest rate scenarios.
Our review of NMD betas started with a comparison of the change in NMD offering rates over the course of 2020 to the down-rate beta assumptions currently employed in a client’s model. For the clients we examined, nearly all showed a rate of change in deposit rates that exceeded the down-rate betas that were used in the model. This indicated that the model was underestimating the change in NMD rates when market interest rates declined. We also found that decay rates on core NMD balances (net of the surge produced by fiscal stimulus programs) declined as many depositors were spending less during the pandemic and maintaining higher-than-average monthly balances. This indicated that actual deposit runoff was slower than what our models were estimating.
We recalibrated the down-rate betas and decay rates by updating the bank’s Advanced Core Deposit Study with data through the end of 2020, then changing the observation period for estimating down-rate betas and decay rates to July 2019 to December 2020. The results of this analysis provided more accurate betas and decay rates which were then applied to the models.
In addition to reviewing and recalibrating loan prepayment and NMD repricing assumptions, we strongly recommend that community banks stress test these key model assumptions on a regular basis, at least annually. Stress tests can reveal just how sensitive the interest rate risk profile is to changes in the model when we ask the question: “What if these assumptions are wrong or inaccurate?” Stress tests are not only a frequent request from the examiners, they are also a good practice for bank management.
Conclusion
Interest rate risk models must adapt to changes in market environments and changes in a bank’s asset-liability mix and risk profile. As we have shown in this newsletter, rapid, unanticipated changes in market environments can pose a great challenge to the accuracy of interest rate risk models. By using tool’s like UMB’s Loan Prepayment Calculator and Advanced Core Deposit Study, we can establish and enhance key interest rate risk model assumptions and address the interest rate risk measurement needs of our clients in any environment.
Learn how UMB Bank Capital Markets Division’s fixed income sales and trading solutions can support your bank or organization, or contact us to be connected with a team member.
This communication is provided for informational purposes only. UMB Bank, n.a., UMB Financial Services, Inc. and UMB Financial Corporation are not liable for any errors, omissions, or misstatements. This is not an offer or solicitation for the purchase or sale of any financial instrument, nor a solicitation to participate in any trading strategy, nor an official confirmation of any transaction. The information is believed to be reliable, but we do not warrant its completeness or accuracy. Past performance is no indication of future results. The numbers cited are for illustrative purposes only. UMB Financial Corporation, its affiliates, and its employees are not in the business of providing tax or legal advice. Any materials or tax‐related statements are not intended or written to be used, and cannot be used or relied upon, by any such taxpayer for the purpose of avoiding tax penalties. Any such taxpayer should seek advice based on the taxpayer’s particular circumstances from an independent tax advisor. The opinions expressed herein are those of the author and do not necessarily represent the opinions of UMB Bank, n.a., UMB Financial Services, Inc. or UMB Financial Corporation.
Products offered through UMB Bank, n.a. Capital Markets Division and UMB Financial Services, Inc. are:
NOT FDIC INSURED | MAY LOSE VALUE | NOT BANK GUARANTEED