Around this time last year, much of the U.S. Treasury curve was sub 2%, the consumer price index (CPI) year-over-year had steadily been climbing (7.9% in Feb. 2022 and still on the rise), core personal consumption expenditures (PCE) year-over-year was 5.40% and the Federal Open Market Committee (FOMC) was preparing markets for Fed target rate hikes. We ultimately saw liftoff with a 25 basis point (bps) hike on March 16, 2022.
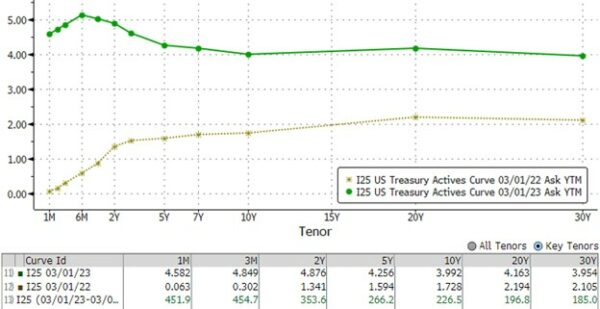
Fast forward a year: Treasuries were well north of 4%, CPI year-over-year and PCE year-over-year have remained stubbornly high (6.4% and 4.70% respectively in Jan. 2023) despite the FOMC hiking 450 bps and potentially positioned for more.
What a difference a year makes (see chart). The sharp pace of the Fed Rate increases throughout much of last year and the subsequent climb in Treasury yields resulted in escalated unrealized portfolio losses industry-wide. Significant unrealized losses were something many were unaccustomed to seeing in their portfolios for several years during the low-rate era, but the combination of the lowest rates in history during the pandemic and the fastest pace of tightening in nearly 50 years produced runaway unrealized losses.
Yet, it is important to note, the other side of those unrealized losses is that today’s reinvestment yields are much higher. Thus, the laddered portfolio many built over the years should be able to reinvest roll-off in significantly higher yields.
U.S. Treasury Curve 2/28/22 vs 2/28/23

More recently, the Fed and the markets had been playing tug of war with differing opinions on future direction of monetary policy and where the economy was heading. Ultimately, it appears the markets are in line with the Fed now, with many changing their expectations and yields have risen. In particular, the market is coming to accept the fact that yields may need to be higher for longer, and that a rate cut in the second half of 2023 and the beginning of a “return to normal rates” is appearing less and less likely.
Neil Kashkari, president of the Minneapolis Fed and an FOMC voter, warned in mid-January that the market would “lose this game of chicken.” Sure enough, 45 days later yields are significantly higher across the curve.
A common theme during all of this has been volatility and an unpredictable market. Managing portfolios through a shifting environment can be challenging, although not impossible, particularly when faced with an inverted yield curve. Duration is often one of the areas of focus when managing one’s portfolio and can be an even greater focus area in times such as these. Specifically, as the 5-10 year part of the curve moves to reflect the current sentiment that we may – or may not – see a longer period of higher rates, investors may want to lock in yields at these levels for the medium-longer term.
During the pandemic, many institutions extended duration, compounding the losses now in their portfolio, and as a response are hesitant to add duration now or even maintain the pre-pandemic duration norms in their portfolio. No one could have guessed that the rates would increase to this degree or pace. Now that they are this elevated, we advise a heightened focus on your investment portfolio duration. Book limited optionality, extended duration instruments even if at lower par amounts than usual. You may be acquiring the ability to exit the pandemic low yields in the process.
Finding the right product that offers the desired duration and attractive yield can be challenging. Issuers have been more than willing to offer callable structures at attractive yields, with the expectation that rates will be lower in a year or two, when the call option will allow them to reset their liabilities to cheaper levels.
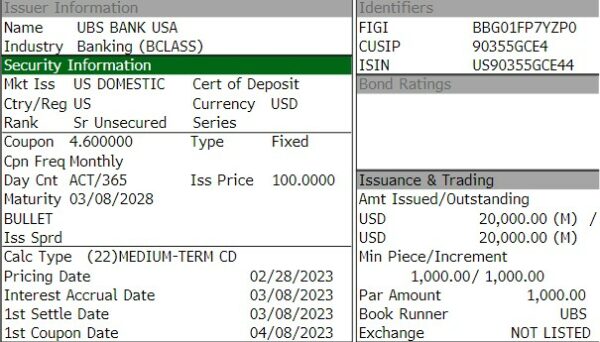
At the time of this writing in early March, attractive options were beginning to appear. For example, after an extended period of CD yields lagging and offering little additional value over treasuries, options are now appearing out in the five-year space at +35 bps to comparable treasuries, a reasonable spread.

Twenty-year and 30-year mortgage-backed securities (MBS) can offer clients duration with high levels of current income while trading at a discount to par, protecting investors from weakening yields in an eventual declining rate scenario. Locking in 5+% yields regardless of the forward rate environment may look attractive to investors who are willing to buy bonds further out the curve.
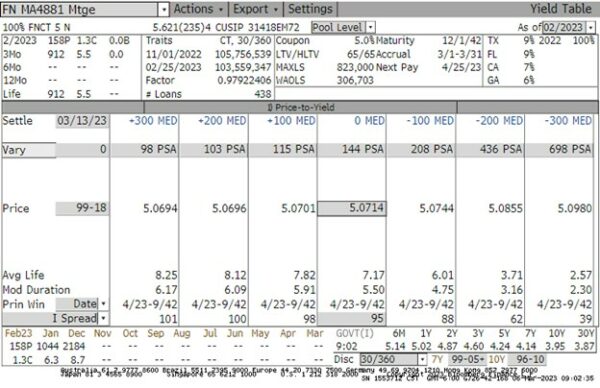
Even with the ability of these securities to shorten in duration in a falling rate environment as prepayments rise, the profile can look attractive versus a callable security with only 6-12 months of call protection. Deeper discount MBS also has the benefit of offering neutral or even positive convexity, a rarity in the MBS world. For instance, consider this FN MA4881 20-year 5c available below par with a 5.621 WAC.

If you purchase MBS, you undoubtedly recall the high-dollar-handle premiums that resulted from the pandemic bottoming out of yields, and especially the way prepayment speeds spiked as homeowners rushed to book these very low yields.
Though many are simply avoiding MBS as a result, we encourage simply including a screening process that evaluates super-fast and super-slow speeds such as this CPR stress of FN MA4881 illustrating positive convexity, the increased yields in a declining rate, accelerated prepayment event.

Investors who have been willing to focus on laddered bond portfolios are currently being rewarded with reinvestment opportunities at better yields than we’ve seen in more than a decade. Continuing to build a balanced portfolio, with appropriate weighting to the short/medium/long ends of the curve may help fixed-income portfolios weather higher-than-average volatility and assist investors in taking advantage of this period of higher rates.
All graphs sourced from Bloomberg.
Learn how UMB Bank Capital Markets Division’s fixed income sales and trading solutions can support your bank or organization, or contact us to be connected with a team member.
Disclosure:
This communication is provided for informational purposes only. UMB Bank, n.a. and UMB Financial Corporation are not liable for any errors, omissions, or misstatements. This is not an offer or solicitation for the purchase or sale of any financial instrument, nor a solicitation to participate in any trading strategy, nor an official confirmation of any transaction. The information is believed to be reliable, but we do not warrant its completeness or accuracy. Past performance is no indication of future results. The numbers cited are for illustrative purposes only. UMB Financial Corporation, its affiliates, and its employees are not in the business of providing tax or legal advice. Any materials or tax‐related statements are not intended or written to be used, and cannot be used or relied upon, by any such taxpayer for the purpose of avoiding tax penalties. Any such taxpayer should seek advice based on the taxpayer’s particular circumstances from an independent tax advisor. The opinions expressed herein are those of the author and do not necessarily represent the opinions of UMB Bank or UMB Financial Corporation.
Products, Services and Securities offered through UMB Bank, n.a. Capital Markets Division are:
NOT FDIC INSURED | MAY LOSE VALUE | NOT BANK GUARANTEED


