As we approach the June Federal Open Market Committee (FOMC) meeting, markets are expecting another 50-basis point (bps) interest rate hike. This economic tightening cycle has come after an absolute roller coaster of an economy over the past 2 years. How did the Federal Reserve get to this point in the interest rate cycle and what lessons can we learn from history?
In recent history, we can see a pattern of boom-and-bust economic cycles that go hand-in-hand with interest rate increases and decreases alike. This article will look at several economic cycles dating back to the early 1980s and compare and contrast the similarities to our current situation.
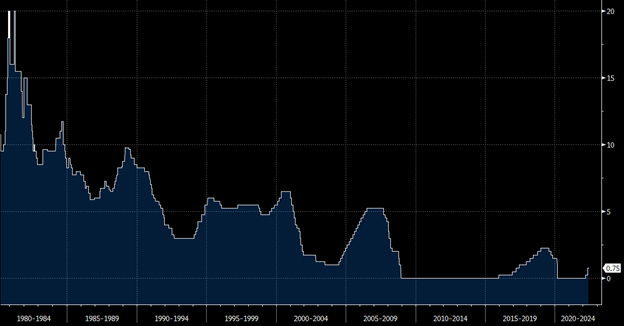
Runaway inflation – sound familiar? In the early 1980s the Federal Reserve, led by Fed Chair Paul Volcker, responded to historic inflation with a series of interest rate hikes that brought the overnight borrowing rate all the way up to 20%. This was an incredible tightening cycle that throttled the economy and sent the U.S. into the worst recession since World War 2.
The recession lasted from July 1981 to November 1982 and saw an unemployment rate of 11%, which to this day remains the apex since World War 2. Manufacturing, construction, and auto industries were largely affected and saw 22-24% unemployment rates. This recession came on the heels of a shorter 1980 recession which was also triggered by interest rate hikes in an effort to combat inflation.
Inflation during this period is thought to be the result of the oil crisis of the 1970s, government overspending and the self-fulfilling prophecy of the wage price spiral. Paul Volcker was appointed Chair of the Federal Reserve due to his anti-inflationary stance. His view was that short-term pain brought on by sharp interest rate increases would be the lesser evil to persistently high inflation.
The Federal Reserve’s tightening eventually accomplished the goal of bringing down inflation from a high of 14.8% in 1980 to 5% in 1982. This was not a so-called soft landing, achieving low inflation while retaining strong employment, and instead produced one of the most severe recession in U.S. history at the time. The Dow Jones Industrial Average dropped 24% and unemployment peaked at 11%.
Fast forward to the 1990s and we have seen interest rates slowly drifting downwards from the incredibly elevated levels of the 1980s. The Federal Reserve consistently eased the economy throughout the 1990s and helped create some excess with their easy monetary policy. Easy monetary policy enables the economy to thrive due to the cheap cost of money. This helps fuel the economy by encouraging interest sensitive spending and business formation, but it can also enable excessive risk taking.
By 2001, there was a massive increase in technology firms in the NASDAQ Composite Index brought on by the internet boom. In a matter of a year, the NASDAQ Index had more than doubled and it was not uncommon for technology IPOs to have in excess of 100% returns on their first day trading.
The Federal Reserve took note of the screaming economy and stepped in to stop the economy from overheating. The Federal Reserve, led by Alan Greenspan, increased the Fed Funds rate six times between June 1999 and May 2000. It was too little, too late for the Fed this time as the NASDAQ had fallen by 78% from its peak. This in conjunction with the September 11 terrorist attacks brought the U.S. economy to its’ knees.
The U.S. entered a mild recession which saw unemployment increase to 6.3% with much of the damage done in Silicon Valley. Alan Greenspan decided to methodically cut interest rates to 1% starting in 2001 and ending in 2003. After 11 individual interest rate cuts, the economy had its’ feet back under it and entered into an expansionary phase that lasted until 2008.

Federal Funds Target Rate – Source: Bloomberg
The Great Recession came on the heels of an extended expansion in U.S. housing construction, home prices, and credit. Home prices more than doubled in an 8-year period between 1998 and 2006 while home ownership rose to 69% in 2005. Roughly 40% of net private sector job creation between 2001 and 2005 was attributable to housing-related sectors. Meanwhile mortgage debt of U.S. households rose to 97% of GDP in 2006.
The runup in housing was in large part fueled by low interest rates coupled with wide access to credit thanks to the repackaging of subprime loans into mortgage-baked securities. Home prices ultimately fell by more than 20%, on average, resulting in a large increase in mortgage defaults and losses for holders of mortgage-related securities.
Wall Street’s exposure to this market resulted in many financial institutions, large and small, going bankrupt, acquired, or requiring a bailout. In effort to soften the blow and restimulate the economy, the FOMC lowered the Fed Funds rate from 4.5% in 2007 to 2% in September 2008 before reducing borrowing rates to a 0 to 25 bps range at the end of 2008.
Additionally, the Federal Reserve initiated the first version of quantitative easing (QE) as it purchased treasury and mortgage-backed securities in an effort to suppress borrowing rates tied to the longer end of the curve. The accommodative stance remained until the Fed began tightening financial conditions slowly and methodically in 2015. The tightening cycle was thrown off kilter by the COVID-19 pandemic in 2020 with the Fed again dropping rates to the zero bound.
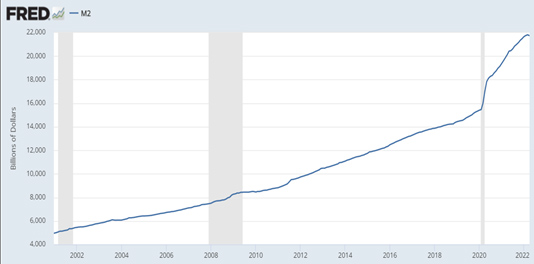
Additional measures taken by the Fed in 2020 include monthly asset purchased of $120 billion made up of $80 billion in treasuries and $40 billion in mortgage-backed securities. Fiscal stimulus was a new addition this time as the federal government stepped in with direct payments to individuals and businesses. These stimulating measures resulted in a massive increase in the M2 money supply as seen below.
Other stimulative measures included moratoriums on mortgages, student debt, and rent in addition to the expansion of child tax credits and forgivable loans. With the Federal Reserve and government both stimulating the economy, a sharp rebound ensued. This fiscal-induced demand met kinked supply chains resulting in the highest inflation since the 1980s.
With the Fed admitting fault on the transitory outlook and inflation showing no signs of abating, we are now in the throes of another tightening cycle. With the concern shifting from employment to inflation, the Fed has taken a hawkish turn with the first 50 bps rate increase since 2000 coming on the heels of a 25 bps hike earlier in this year. The Fed now forecasts 50 bps hikes at the next two meetings which the market has priced in.
Additionally, quantitative tightening has been telegraphed as the Fed looks to pare down its $9 trillion balance sheet. This will be accomplished by allowing maturities to roll off; a number expected to reach $95 billion by August. Actively selling down the portfolio has not been ruled out. The Fed enters this tightening period with a hard-earned dose of humility in wake of their transitory miss which dominated Fed speak until late 2021. The Fed now faces exogenous shocks to oil and commodity markets as Russia’s war in Ukraine persists and China adds further inflationary pressures as their zero-COVID policy crimps production in a world heavily dependent upon its output.
Further, the backdrop lends to a serious risk of wage-price spiral as a hot labor market affords workers the upper hand as they push to keep wages running in excess of inflation as seen in the 1970s. A run up in home prices fueled in part by low borrowing costs risks being knocked off kilter as mortgage rates reprice higher with the Fed. As the Fed looks to guide the economy to a so-called soft-landing, the realization that demand destruction is their ultimate tool has markets spooked. Will the Fed have to force a recession to get inflation in check? If not, will their move-first method evidenced by the fastest tightening in decade unintentionally push us into one?

M2 Money Supply – Source: St. Louis Federal Reserve
Learn how UMB Bank Capital Markets Division’s fixed income sales and trading solutions can support your bank or organization, or contact us to be connected with a Capital Markets Division team member.


